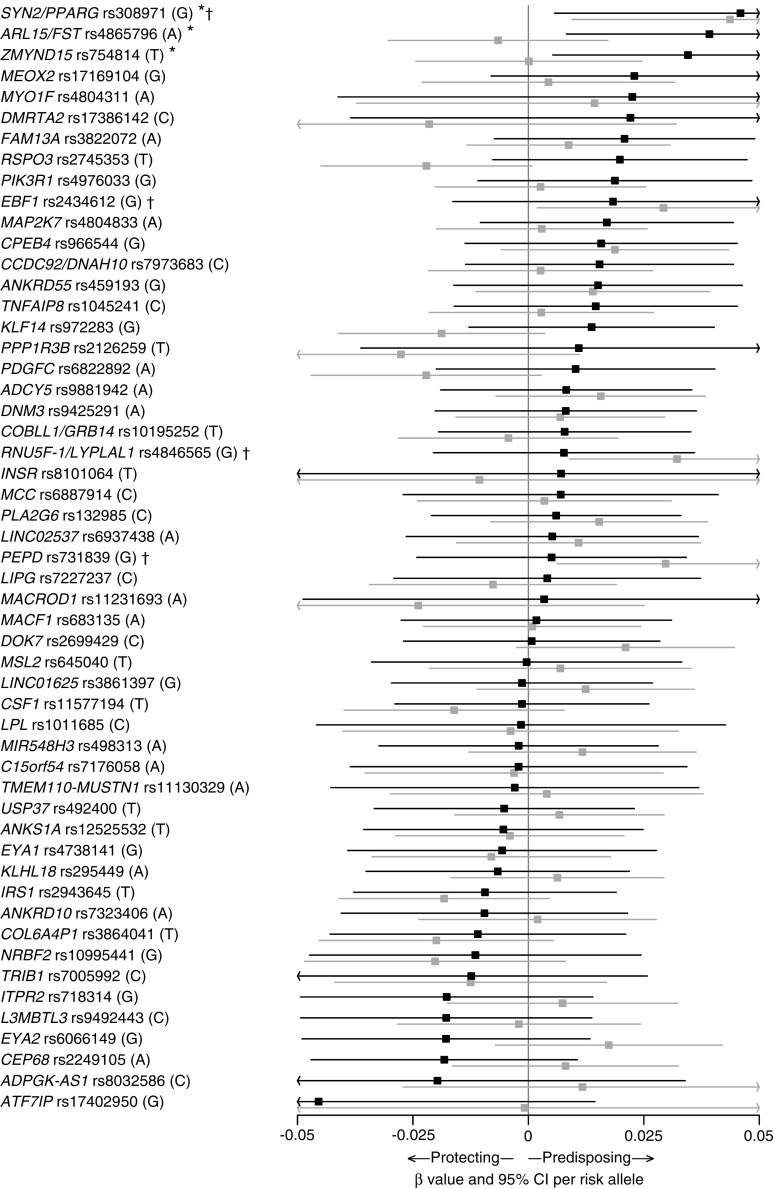
Fig. 1.
SNP-specific associations with HOMA-IR in children from the TCOCT sample (black lines) and population-based control sample (grey lines). For each SNP, the name of the nearest gene, rs number and risk allele as reported [9] are provided. *p < 0.05 for the association between the given SNP and HOMA-IR in the TCOCT sample. †p < 0.05 for the association between the given SNP and HOMA-IR in the population-based sample

