
Fig. 2.
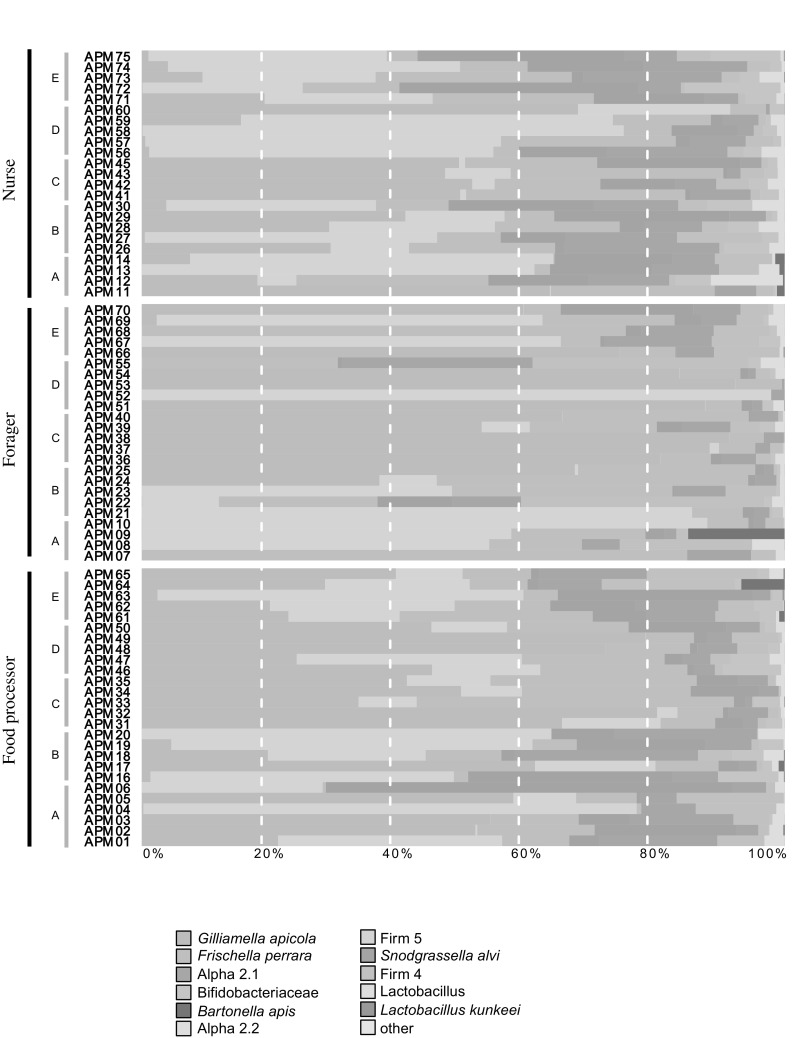
Taxonomic composition of the gut microbiome of honey bee workers performing different behavioural tasks. The proportion of each taxa in the total microbiome is represented as the proportion of the coloured bar
Official websites use .gov
A
.gov website belongs to an official
government organization in the United States.
Secure .gov websites use HTTPS
A lock (
) or https:// means you've safely
connected to the .gov website. Share sensitive
information only on official, secure websites.
Taxonomic composition of the gut microbiome of honey bee workers performing different behavioural tasks. The proportion of each taxa in the total microbiome is represented as the proportion of the coloured bar