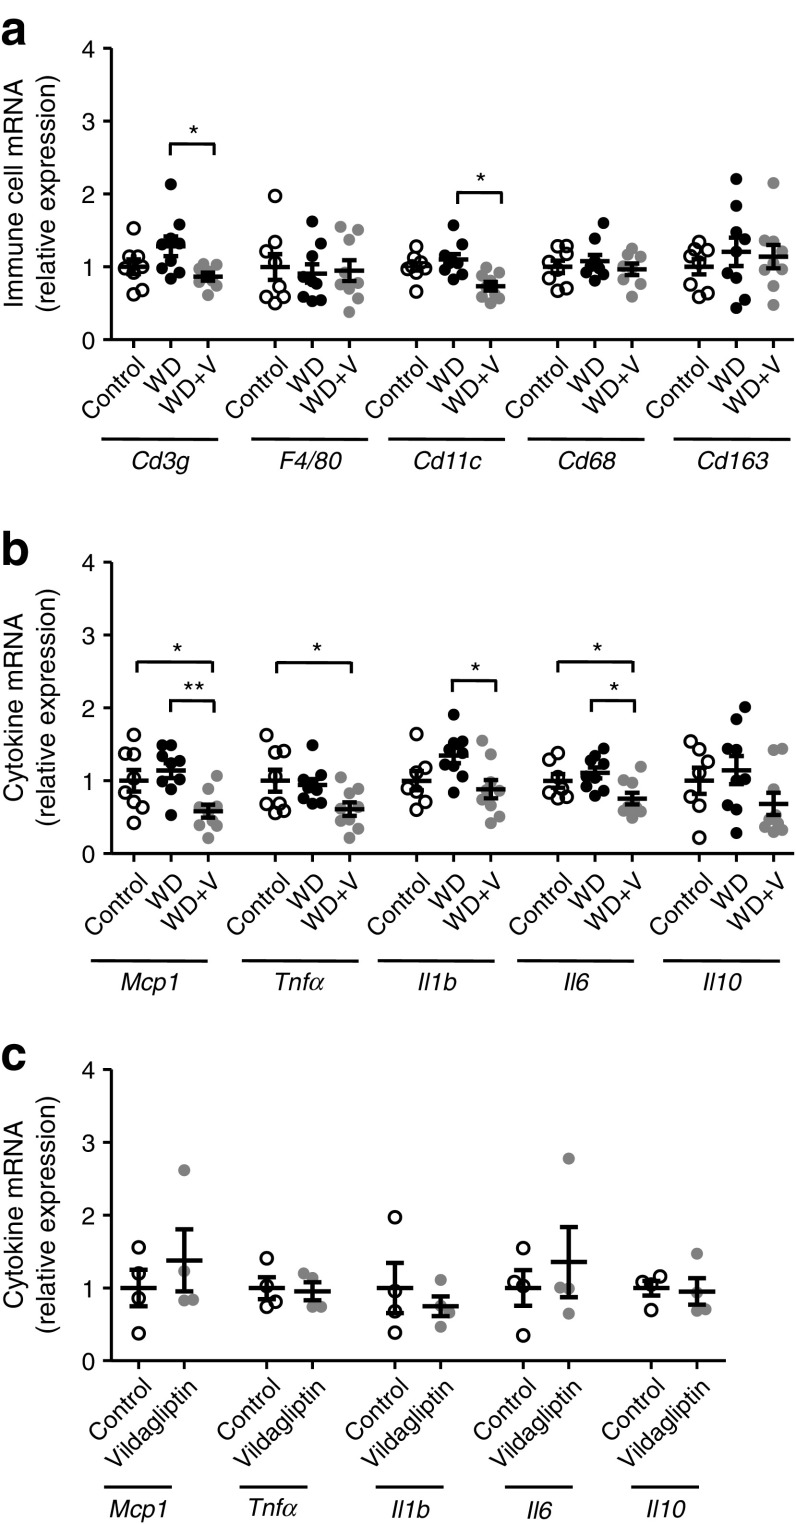
Fig. 9.
In an in vivo experiment, mice were fed a control diet, a WD or a WD + vildagliptin (WD+V). In an ex vivo experiment, PCLS were exposed to a control medium or medium with vildagliptin. Gene expression of (a) biomarkers of immune cell populations, and (b) cytokines in the liver in the in vivo experiment and (c) cytokines in PCLS in the ex vivo experiment. In (a, b), significant differences between conditions are shown as *p < 0.05 and **p < 0.01 according to one-way ANOVA followed by Tukey’s post hoc test. In (c), data were analysed with Welch’s t test

