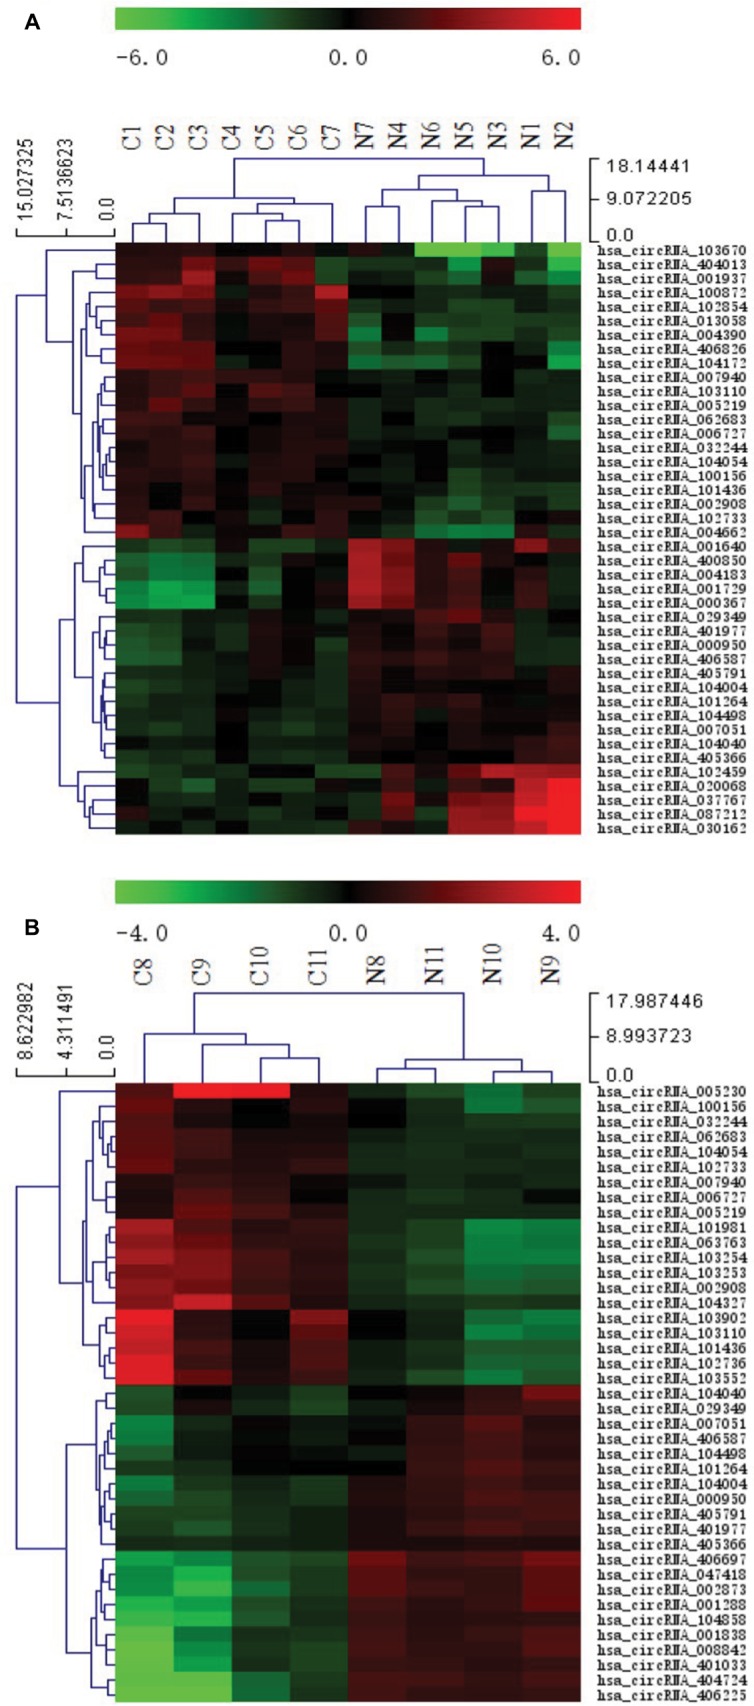
Figure 1.

Heat map showing the expression profiles of circRNAs in ESCC (A) and BC (B).
Notes: The expression values are represented by the color scale. The intensity increases from green (relatively lower expression) to red (relatively higher expression). Each column represents one tissue sample, and each row represents a single circRNA. C1–C7 represent seven ESCC specimens collected from ESCC patients. N1–N7 represent paired adjacent normal-appearing tissues. C8–C11 represent four BC specimens collected from BC patients. N8–N11 represent paired adjacent normal-appearing tissues.
Abbreviations: ESCC, esophageal squamous cell cancer; BC, breast cancer.
