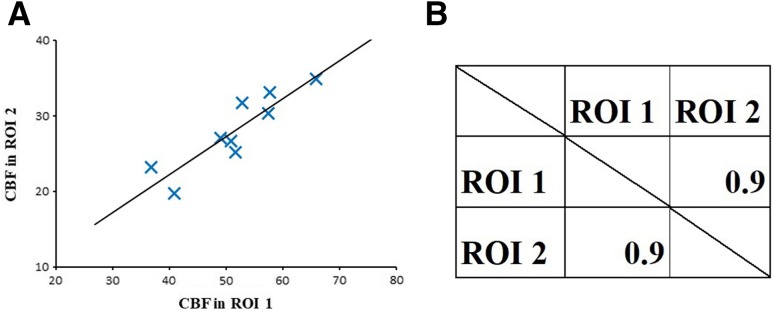
Fig. 2.
Correlation analysis between pairs of brain regions and correlation matrices. Above example calculated the intersubject Pearson’s correlation coefficient between a pair of brain regions showing a significant positive correlation. Each plot in the left graph represents the data for one subject

