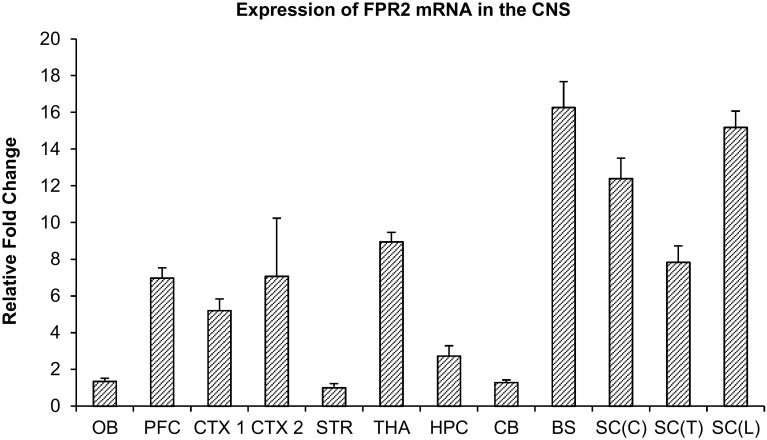
Fig. 1.
Real-time RT-PCR analysis of FPR2 mRNA expression in various parts of the rat brain including olfactory bulb (OB), prefrontal cortex (PFC), primary somatosensory cortex (CTX1), parietal association cortex and secondary auditory cortex (CTX2), striatum (STR), thalamus and hypothalamus (THA), hippocampus (HPC), cerebellum (CB), brainstem (BS), cervical spinal cord [SC(C)], thoracic spinal cord [SC(T)], and lumbar spinal cord [SC(L)].Fold change values were normalized to the lowest expressing FPR2 mRNA in the striatum. Data represents mean and standard error from 4 Wistar rats

