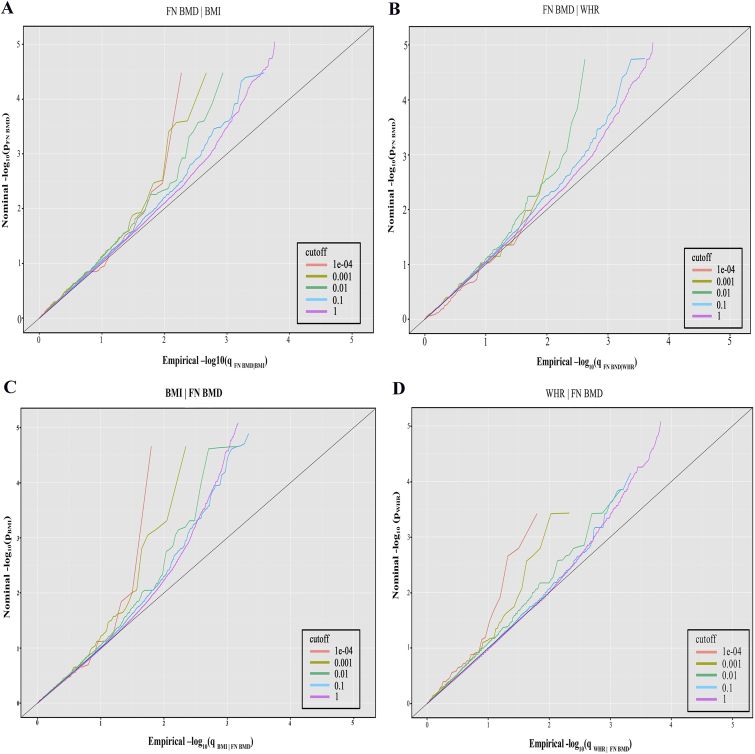
Figure 1.
Stratified Q-Q plots of nominal vs empirical –log10P values in principal trait below the standard GWAS threshold of P < 5.0 × 10⁻⁸ as a function of significance of the association with conditional trait at the level of P < 1, P < 0.1, P < 0.01, P < 0.001, and P < 0.0001, respectively. (A) FN BMD|BMI (FN BMD conditional on BMI), (B) FN BMD|WHR, (C) BMI|FN BMD, and (D) WHR|FN BMD. The diagonal indicates the null hypothesis.

