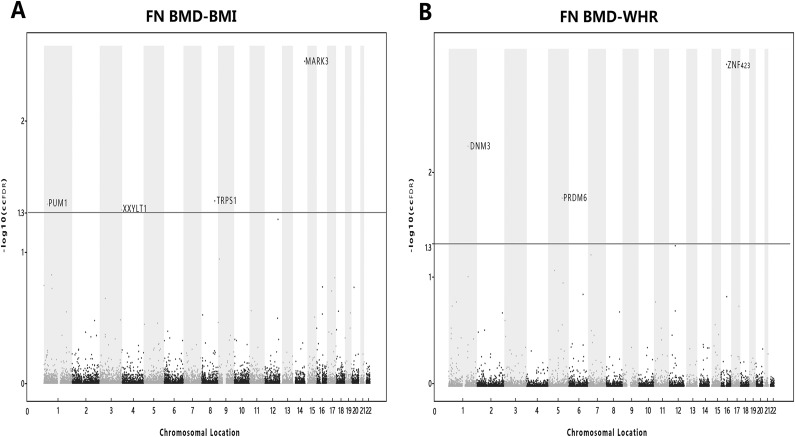
Figure 2.
Conjunction Manhattan plot of conjunction –log10 ccFDR values for FN BMD and BMI or FN BMD and WHR, and the solid line marking the –log10 ccFDR value of 1.3 corresponds to a ccFDR of 0.05. (A) FN BMD and BMI and (B) FN BMD and WHR. The figure shows the genomic locations of pleiotropic loci.

