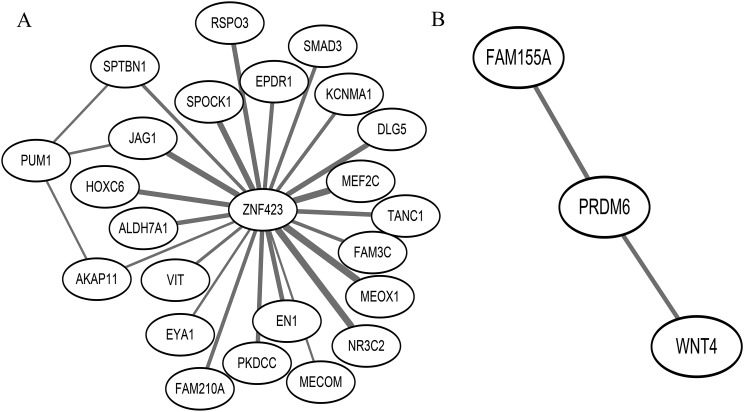
Figure 3.
(A) ZNF423 and PUM1 centered network view, which characterizes the coexpression relationships for ZNF423 and PUM1 with BMD-associated genes in the osteoporosis turquoise module. This network view includes all edges and their corresponding nodes connected to ZNF423 and PUM1 with a TOM ≥0.10. The width of edges presents the value of TOM; the larger the TOM, the larger the width of the edge. All of the correlations between nodes are positive. (B) PRDM6 centered network view in the osteoporosis blue module, which presents the edges and nodes connected with PRDM6 with TOM ≥0.10.

