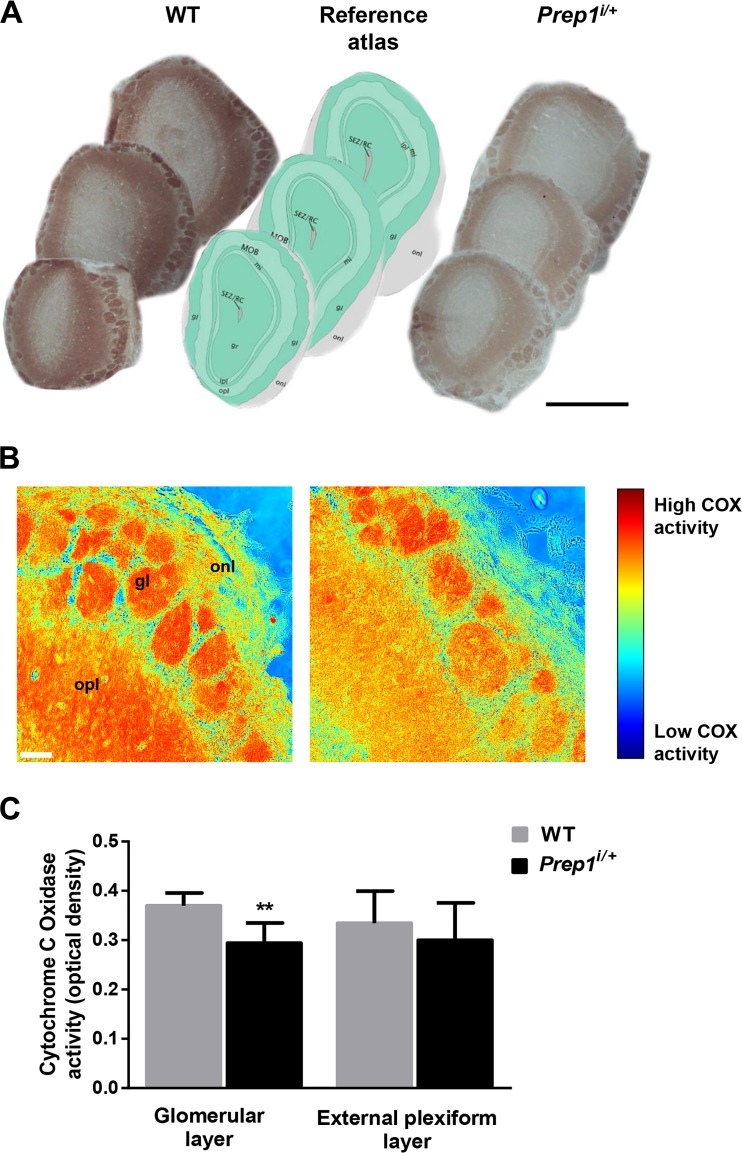
Fig. 3.
COX staining of Prep1i/+ mice OB sections. a Representative images of COX staining of olfactory bulb from Prep1i/+ and WT mice are shown (original magnification ×5; scale bar, 1 mm). Reference drawings have been adapted from Allen Brain Reference Atlas®. b Higher magnification (original magnification ×20; scale bar, 50 μm) of COX-stained OB sections represented with pseudo-colors to better show differences in staining intensity. gl, glomerular layer; epl, external plexiform layer. c Quantification of COX activity has been performed by ImageJ®. Bars represent mean ± SEM of COX optical density in different olfactory bulb layers. Asterisks denote statistically significant differences (**p < 0.01). gl, glomerular layer; gr, granular layer; opl, outer plexiform layer; ml, mitral layer; ipl, inner plexiform layer; onl, olfactory nerve layer; MOB, main olfactory bulb; SEZ/RC, sub-ependymal zone

