Fig. 6.
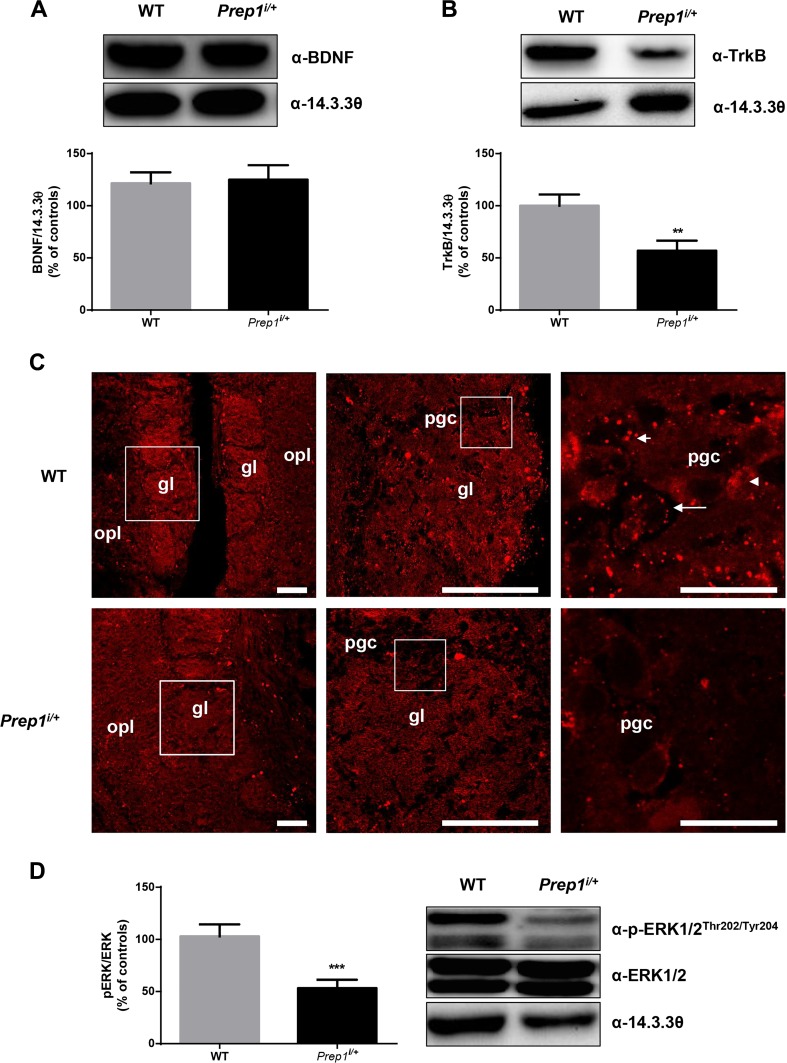
BDNF-TrkB signaling in Prep1i/+ mice OB. a BDNF protein levels in OBs from WT and Prep1i/+ mice. b TrkB protein levels from OBs from WT and Prep1i/+ mice. c Immunofluorescence for TrkB in WT and Prep1i/+ mice olfactory bulb has been analyzed by confocal microscopy as reported in the “Material and Methods” section; three different magnifications are shown to better appreciate the differences (scale bars, 50 μm for left and middle panels; 10 μm for right, high-magnification panels; squares indicate the position of magnified images). TrkB was localized onto the cell membrane (arrows), the cytoplasm (arrowheads), and in the neuropile (short arrows) in a punctate pattern. d p-ERK1/2 and ERK1/2 levels in OBs from WT and Prep1i/+ mice. 14-3-3θ antibody was used for normalization. The autoradiographs shown on the top of the graphic are representative of four independent experiments. Asterisks denote statistically significant differences (**p < 0.01, ***p < 0.001). gl, glomerular layer; opl, outer plexiform layer; pgc, periglomerular cells

