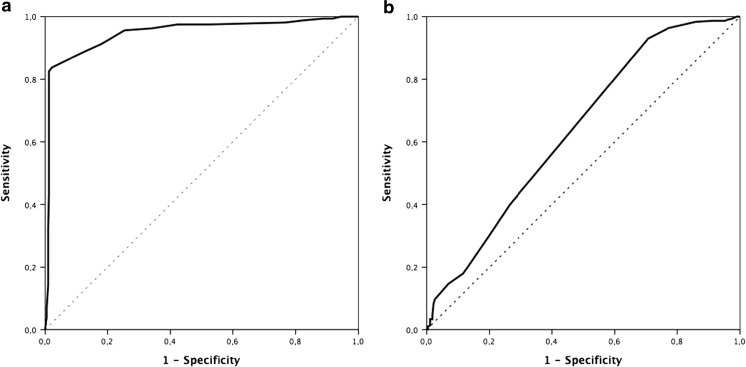
Fig. 1.
ROC curve. Main variable—improvement of mRS from discharge to 3 months. Influence of the difference among the NIHSS in the first 24 h and the main variable. a Patients with fibrinolytic treatment. For a cutoff point of 8, the sensitivity is 82.5% and the specificity is 98.8%. Area under the curve 0.948 (CI 95% 0.924–0.971, P < 0.0001). b Patients without fibrinolytic treatment. Area under the curve 0.636 (CI 95% 0.591–0.682, P = 0.023). It is not possible to establish a cutoff point

