
Fig. 3.
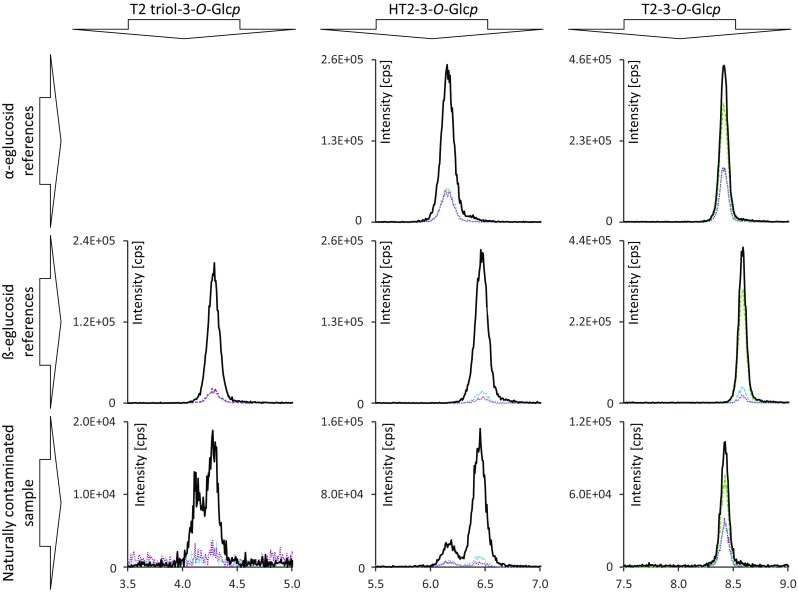
Sections of HPLC-MS/MS chromatograms recorded in SRM mode. The bottom row shows SRM transitions of T2 triol, HT2 and T2 glucosides from left to right in the order of elution. In the top row, peaks corresponding to HT2-3-O-α-Glcp and T2-3-O-α-Glcp are displayed. The middle row shows peaks corresponding to T2 triol-3-O-ß-Glcp, HT2-3-O-ß-Glcp and T2-3-O-ß-Glcp. Retention time and SRM transition intensities allow to distinguish between α and ß configuration