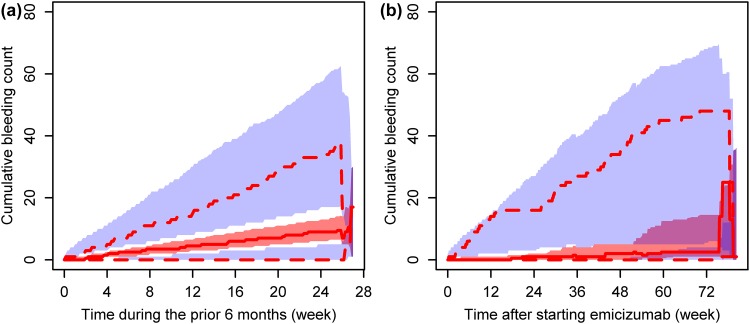
Fig. 3.
Visual predictive check plots for the developed repeated time-to-event model. Data before (a) and after (b) the start of emicizumab treatment are presented. Red solid line indicates the observed median, red dashed lines indicate the observed minimum (lower) and maximum (upper), and shaded areas indicate the simulated 95% confidence intervals of the minimum (blue, bottom), median (red, middle), and maximum (blue, top)

