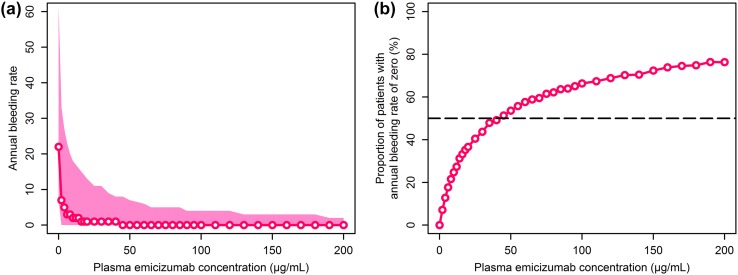
Fig. 4.
Simulated relationship of plasma emicizumab concentration with annual bleeding rate (a) or the proportion of patients with an annual bleeding rate of zero (b). Plotted plasma emicizumab concentrations include every 2 μg/mL from 0 to 20 μg/mL, every 5 μg/mL from 20 to 100 μg/mL, and every 10 μg/mL from 100 to 200 μg/mL. a Open circles and solid line indicate the simulated median, and shaded area indicates the simulated 5th to 95th percentile range; b open circles and solid line indicate the simulated proportion, and dashed line indicates the target proportion of 50%

