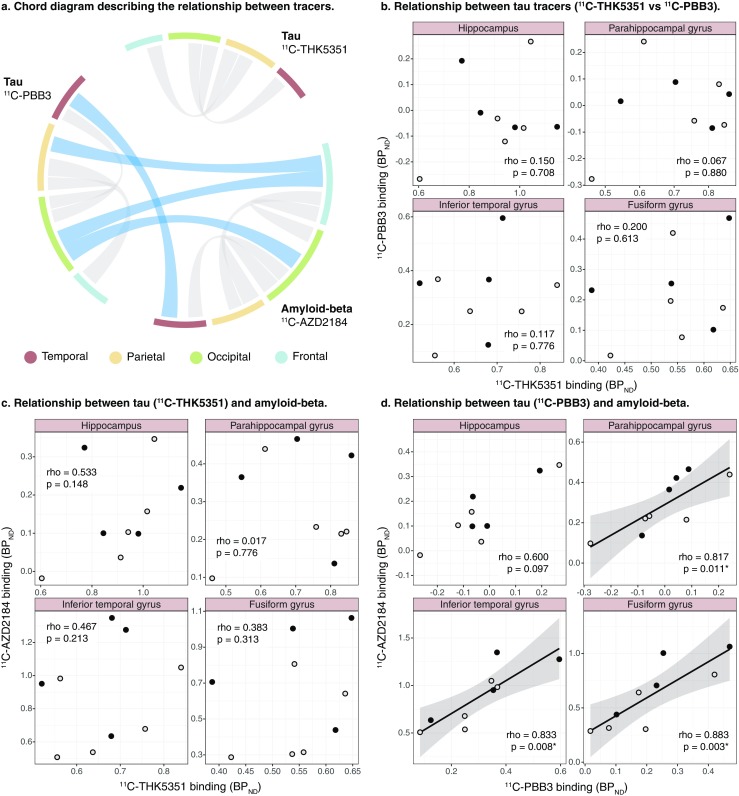
Fig. 3.

Chord diagram (a) and scatterplots (b–d) showing the relationships between the binding (BPND) of the tau tracers 11C-ΤΗΚ5351 and 11C-PBB3, and the amyloid-beta tracer 11C-AZD2184. The results presented were derived from data without correction for the partial volume effect. The weight of the strings in the chord diagram represents the strength of the statistically significant Spearman’s regional correlations within or between tracers (grey and blue strings, respectively). Open circles patients with prodromal Alzheimer’s disease, closed circles patients with Alzheimer’s disease dementia (rho Spearman’s rho). *p < 0.05
