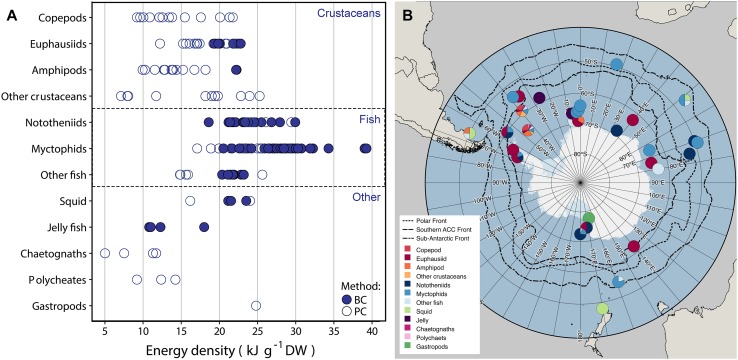
Fig. 1.
a Overview of energy density records per species group. One point represents an average energetic value per species and per record. A distinction is made between measurements done using bomb calorimetry (BC) and proximate composition (PC). Note that one literature source can contain multiple energy density records, for instance of different species or developmental stages, and that, therefore, one point does not represent one literature source. b Overview map of energy density records, including several fronts. One point on the map represents one source. Therefore, a single point can include multiple measurements on a single species or measurements of multiple species from a single group. Approximate locations were derived from the source material. The map was made using Quantarctica from the Norwegian Polar Institute (Matsuoka et al. 2018). Mean front positions were taken from Solokov and Rintoul (2009). Previously unpublished data are included

