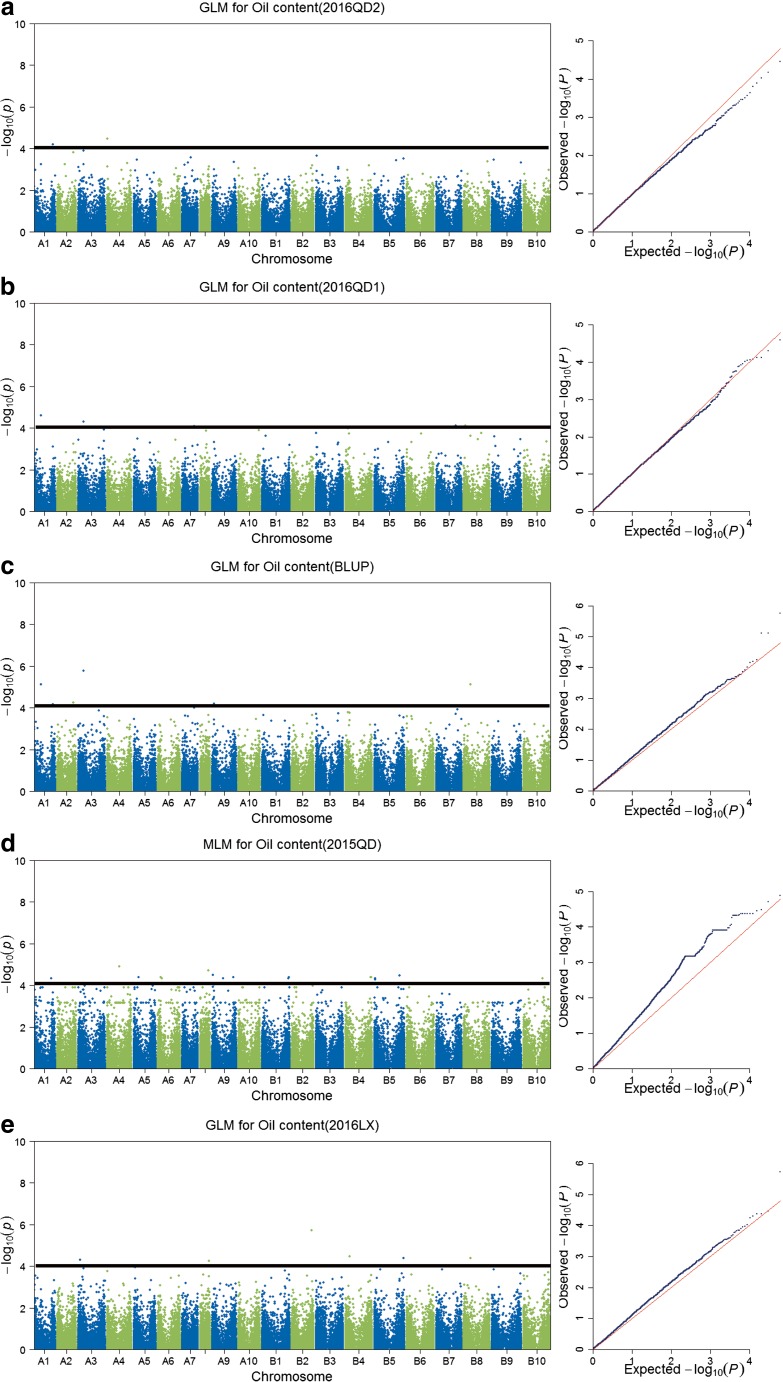
Fig. 2.
Genome-wide association scanned for oil content of peanut. a Manhattan and optimal quantile–quantile plot for oil content detected in 2016QD2 environment. b Manhattan and optimal quantile–quantile plot for oil content detected in 2016QD1 environment. c Manhattan and optimal quantile–quantile plot for oil content using the BLUP value. d Manhattan and optimal quantile–quantile plot for oil content detected in 2015QD environment. e Manhattan and optimal quantile–quantile plot for oil content detected in 2016LX environment

