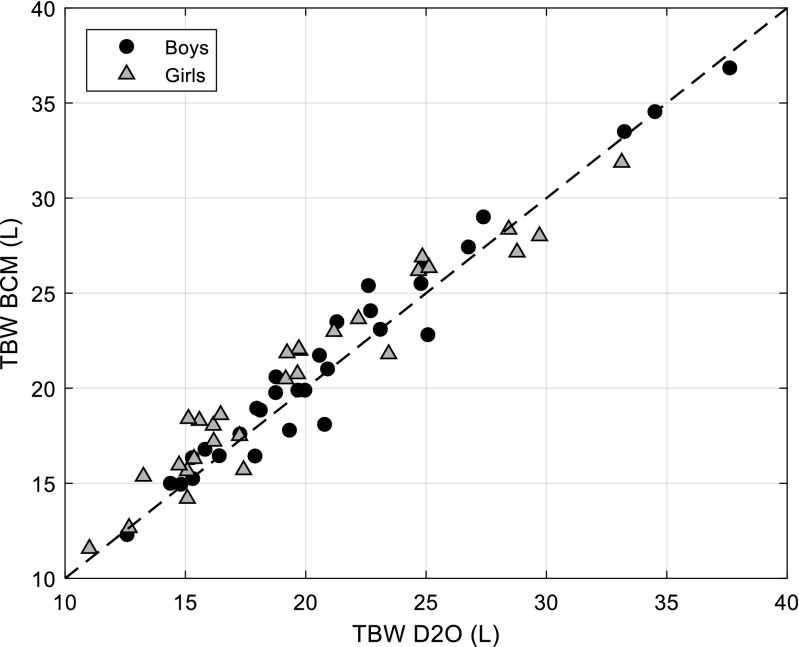
Fig. 1.
TBW BCM vs. TBW D20 in 60 healthy children aged between 6 and 14 years. Corresponding Bland-Altman plot is shown in Supplementary Fig. S1. All subjects R2 = 0.97 (p < 0.001), Girls R2 = 0.97 (p < 0.001) and Boys: R2 = 0.98 (p < 0.001). BCM Body Composition Monitor, D2O deuterium oxide, TBW total body water

