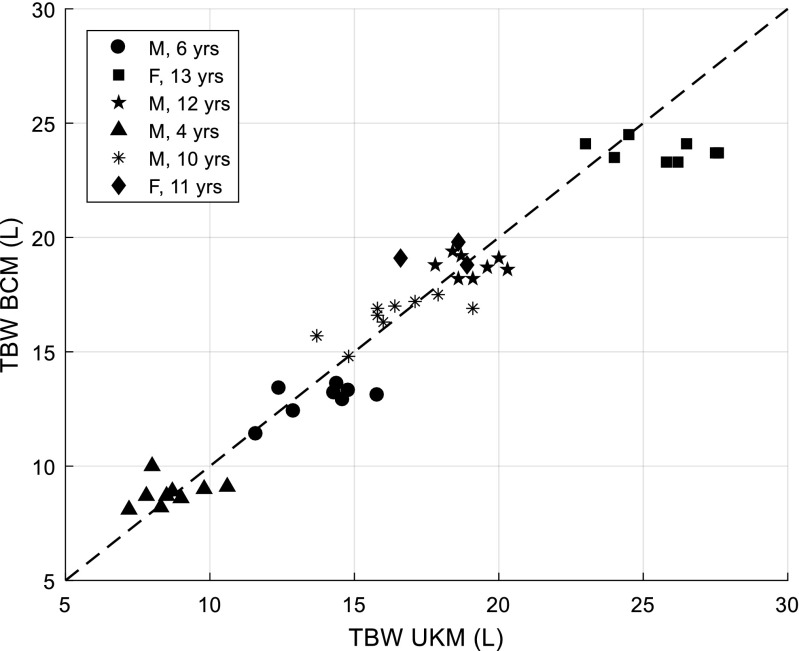
Fig. 2.
TBW_BCM vs. TBW_UKM in 6 children on haemodialysis. Measurements were made over 8 months. Corresponding Bland-Altman plot is shown in Supplementary Fig. S2. The same data but individually averaged is shown in Supplementary Figs. S3 and S4. Dashed line indicates line of identity. TBW total body water, BCM Body Composition Monitor, UKM Urea Kinetic Modelling

