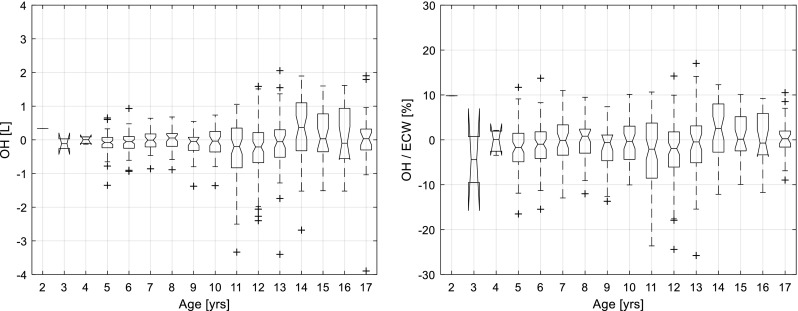
Fig. 3.

BCM-measured OH (a) and OH/ ECW (b) in all healthy children (n = 634). Boxes indicate interquartile range from 25th to 75th percentile, line is the median, notches indicate 95% confidence interval for median, whiskers are 1.5*interquartile range (covering 99.3% of data assuming normal distribution), crosses = outliers. BCM Body Composition Monitor, OH over hydration, ECW extra cellular water
