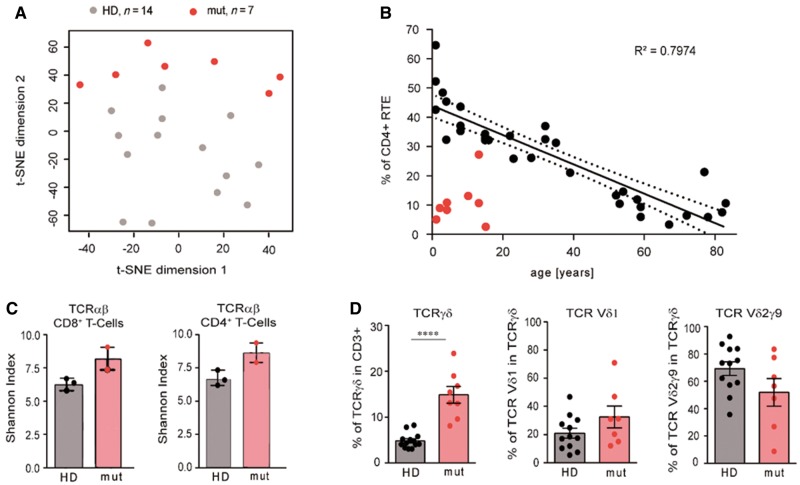
Figure 4.
Impaired T cell development in patients with BCL11B associated disorder. (A) Two-dimensional t-distributed stochastic neighbour embedding (t-SNE) plot showing the clustering of seven BCL11B patients (red circles) and 14 healthy controls aged under 16 (grey circles) according to 102 T cell traits. (B) Frequency of recent thymic emigrants (RTE) (CD4+ CD45RA+ CD31+) in relation to age in control donors (black circles) and BCL11B patients (red circles). (C) Shannon Diversity Index of the TCRαβ-repertoire in CD4 and CD8 T cells in unaffected donors aged 15 (HD) and in individuals with BCL11B mutations (mut). (D) Percentage of T-γδ cells and usage of TCRδ chains in unaffected donors aged under 16 (HD) and in BCL11B patients (mut). *P < 0.05, **P < 0.01, ***P < 0.001, ****P < 0.0001.

