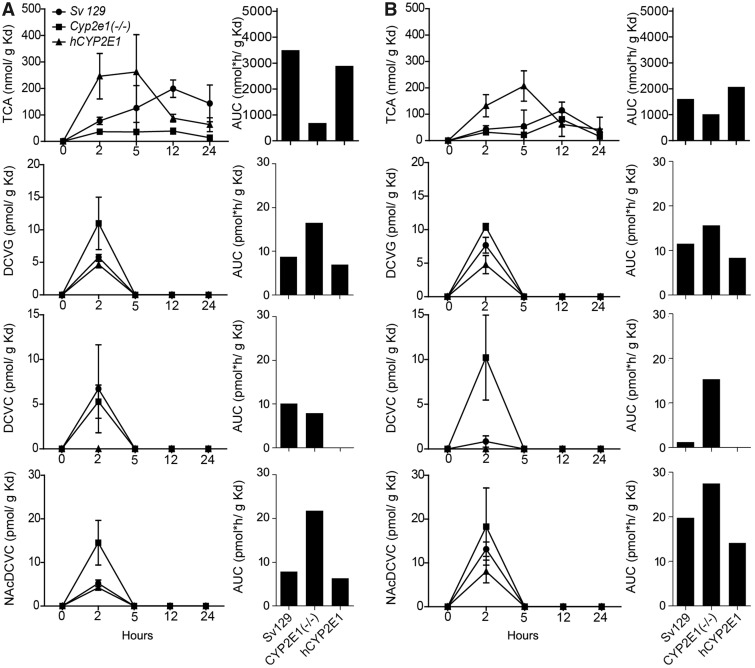
Figure 5.
Comparative analysis of kidney (Kd) toxicokinetics of oxidative (TCA), and GSH conjugation metabolites (DCVG, DCVC, and NAcDCVC) of TCE (single dose, 600 mg/kg) in (A) male and (B) female 129S1/SvlmJ (SV129), Cyp2e1(−/−), and hCYP2E1 mice. Average kinetic profiles (left panels, strains are identified by symbols as shown in an inset in the top left graph) and AUC (right panels) are shown (n = 2–4 per group per time point, as detailed in Supplementary Table 2).

