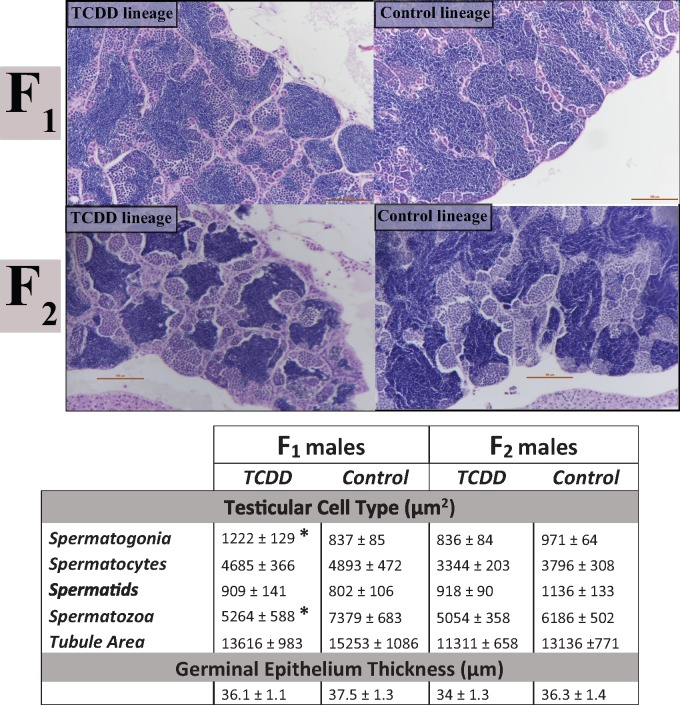
Figure 2.
Quantification of germ cell types within the testes (ImageJ). H&E images of testicular tissue at ×21.6 magnification indicate that TCDD-lineage F1 fish show a decreased area occupied by spermatozoa and an increased area of spermatogonia within seminiferous tubules. F2 fish did not demonstrate differences in germ cell area due to ancestral TCDD exposure compared with controls. Top row consists of F1 TCDD and control (DMSO) lineage testes. Second row consists of F2 TCDD and control (DMSO) lineage testes. Scale bars in images are 100 µm length. Values in the table below indicate the mean area (µm2) ± SEM of each cell type within seminiferous tubules or the mean width of the germinal epithelium (µm) ± SEM for TCDD or control lineages. *Significant difference from control, as defined by p < .05. H&E, Hematoxylin and eosin; TCDD, 2,3,7,8-tetrachlorodibenzo-p-dioxin; DMSO, dimethyl sulfoxide; SEM, Standard Error of the Mean.

