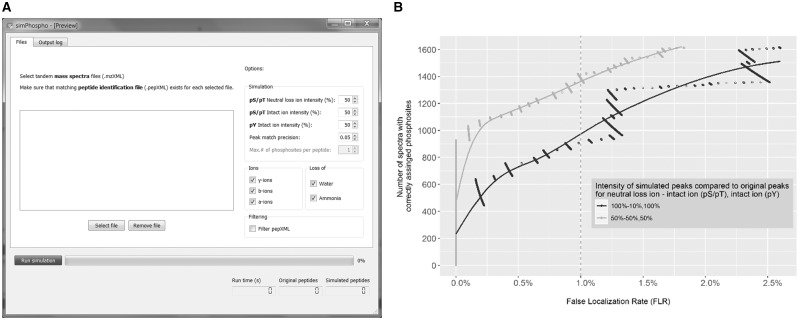
Fig. 1.
(A) Screenshot of SimPhospho displaying the main features of software: simulation options, including ion intensity values, peak match precision, types of ions used for simulation, data filtering switch, as well as output statistics and progress bar. (B) Optimization of intensity values of simulated peaks. To determine the optimal default parameters for SimPhospho, we tested different ion intensity combinations for phosphoric acid neutral loss ions and for intact ions compared to original fragment ion intensities in spectra of nonphosphorylated peptides. We saw the largest number of correctly assigned phosphosites at <1% FLR achieved with a combination of 50 and 50% intensities for intact ions and neutral loss ions for pS and pT, and 50% intensities for intact ions for pY. Data for 100 and 10% (pS, pT) and 100% (pY) are given for reference, as this combination was chosen for the prototype program (Suni et al., 2015). See Supplementary Figure S1 for other intensity combinations

