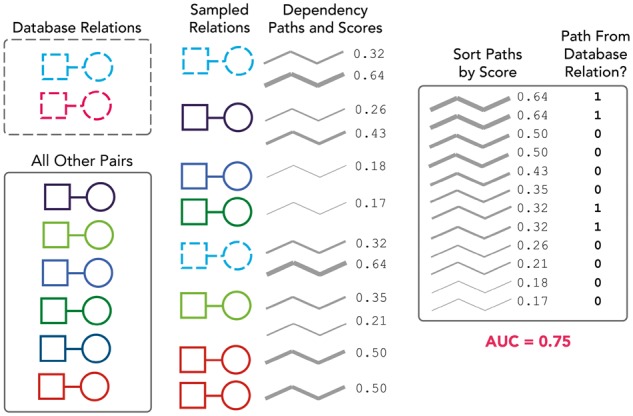
Fig. 2.

Evaluation against known database relations. In this example, the squares represent diseases, the circles represent genes and we are evaluating one particular gene-disease theme. The database contains two relations (gene-disease pairs) that also appear in our dataset (i.e. co-occurred in a sentence at least once, connected by a dependency path to which theme supports could be assigned). There are also six other gene-disease pairs in our dataset that are not found in the database; these serve as our negative ‘background’. We create 100 bootstrap samples by sampling with replacement from both the database and background sets (only a single sample is shown here). We rank all dependency paths that connect our sampled entity pairs based on their supports for the theme. Note that the scores here are fractions and not the raw supports because we normalize the supports across all themes (by dividing by the total support across all themes) so as not to disadvantage less common dependency paths. We then calculate an AUC for the ranking against labels representing whether the entity pair connected by the path was a known database relation (1) or not (0). We repeat this process across all 100 samples and calculate a mean and standard deviation for the AUC
