Fig. 3.

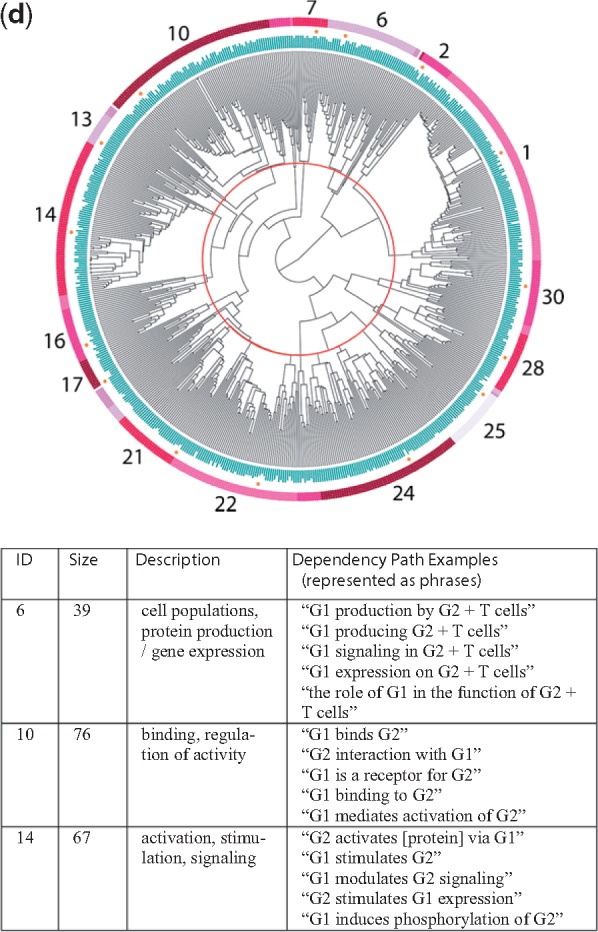
(d) Gene–gene dendrogram. Each leaf node represents one dependency path. In the example patterns above, G1 represents the first gene/protein and G2 the second gene/protein

(d) Gene–gene dendrogram. Each leaf node represents one dependency path. In the example patterns above, G1 represents the first gene/protein and G2 the second gene/protein