
Fig. 4.
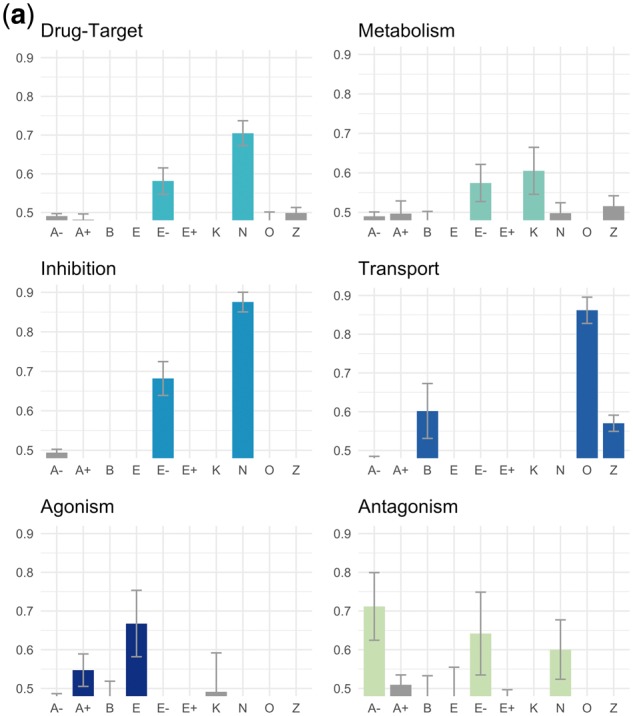
(a) Chemical-gene theme evaluations. This caption refers to (a)–(d). In all cases, the y-axis refers to AUC for ranking dependency paths connecting known database relations against others using scores based on their supports for a given theme (Fig. 2). Descriptions of the theme symbols are in Table 3. Error bars are one standard deviation of AUC across 100 bootstrap replicates. A bar is colored if the mean AUC is >1 SD above 0.5. Some themes led to AUCs <0.5 (i.e. database relations were depleted for these themes instead of enriched) and were cut off because the y-axis starts at 0.5