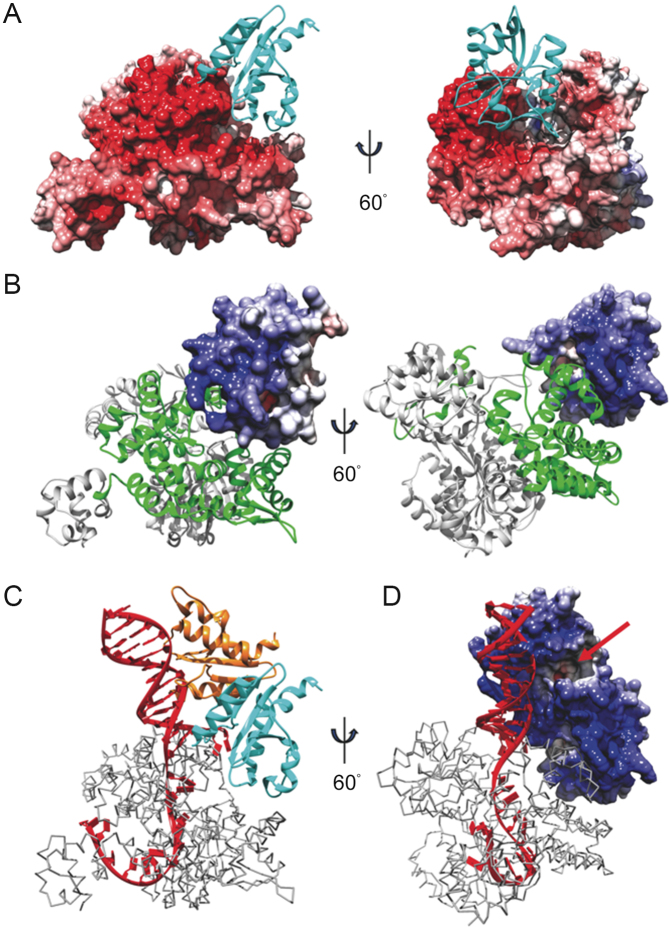
Figure 10.
Modeling Hjm:Hjc unwinding and cleavage of DNA. Docking result showing (A) the electrostatic surface of Hjm interacting with Hjc (cyan ribbons), or (B) the electrostatic surface of Hjc interacting with Hjm (ribbons). The Hjc-interaction region of Hjm is highlighted by green. Model of a Hjc dimer (cyan and orange ribbons (C) or electrostatic surface (D)) bound with Hjm (gray trace) and DNA (red) from PfuHjm:DNA complex (PDB ID: 2P6R) based on results in A&B. The Hjc active site is indicated with a red arrow. Red surface - negative charge, white surface - neutral, blue surface - positive charge.

