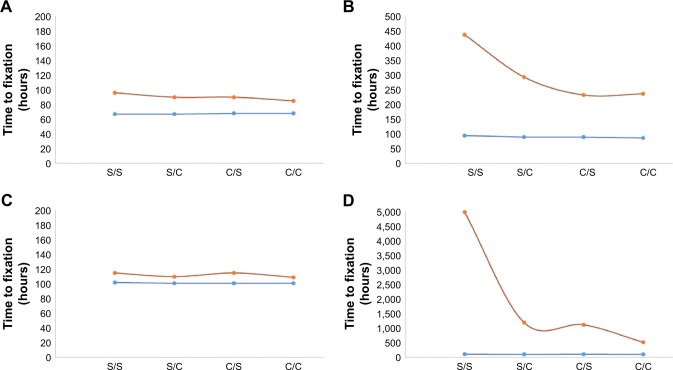
Figure 3.
Categorical plot showing the effect of parameter values β and ψmin on time to fixation, Tfix, for 2 drug concentrations; 3 µg mL−1 (A and C) or 10 µg mL−1 (B and D) of combinations of Cidal and Static drugs (C and S on x-axes) were simulated with β =1 (red) or β =3 (blue) and cycled either every day (A and B) or every 3 days (C and D). C denotes a bactericidal antibiotic, while S denotes a bacteriostatic antibiotic.

