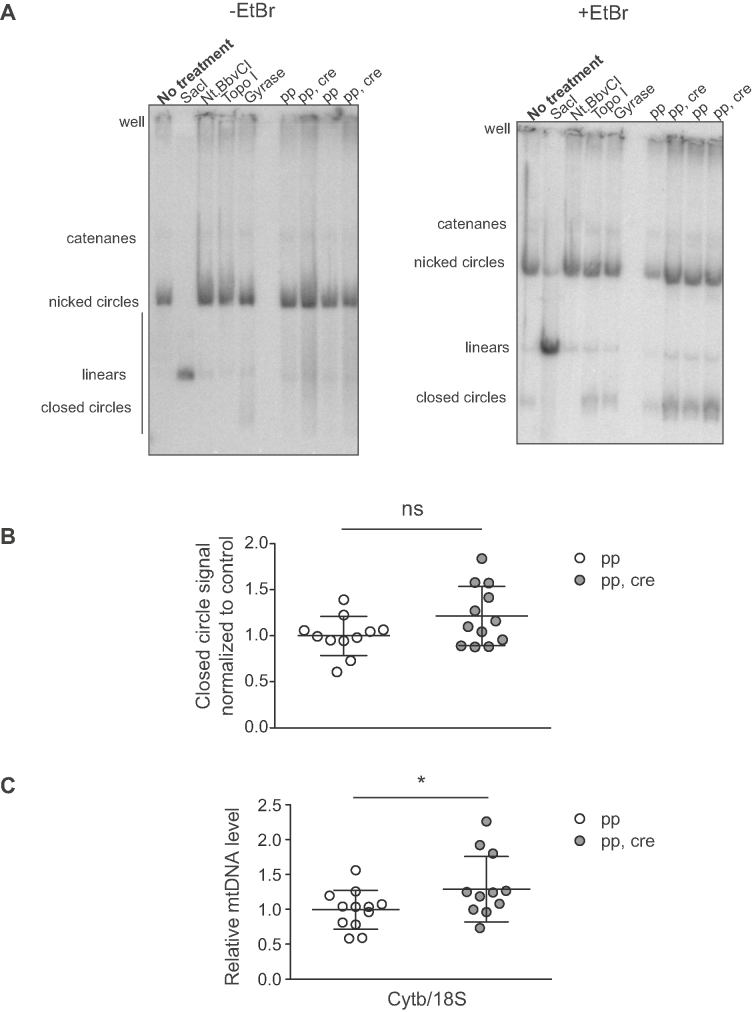
Figure 9.
Heart Sod2 knockout mice show normal mtDNA topology and no decrease in mtDNA copy number. (A) Representative phosphorimager exposure of mtDNA topology analysis of total DNA from heart tissue from 10-week old Sod2 loxP x Ckmm cre mice. MtDNA is visualized using radioactive probes towards mtDNA. Control DNA was treated with various enzymes to reveal the different topologies of mtDNA. SacI cuts both strands of mtDNA once (linear), Nt. BbvCI cuts only one strand of mtDNA (nicked), TopoI relaxes the mtDNA (looser coiling), Gyrase creates coiling to mtDNA (compacted supercoiled DNA). Experimental samples are untreated. First gel does not have ethidium bromide (EtBr), second gel has the same samples and EtBr in the gel to compact the closed circle DNA into a quantifiable band. Phosphorimager images are filtered with averaging to reduce noise. Quantifications were made from the original images. (B) Quantification of the proportion of closed circle form of mtDNA per total mtDNA. Quantification is done from phosphorimager exposure of the topology gels. White circles indicate samples from controls (pp, n = 11, 9–10 week old) and gray circles indicate samples from Sod2 loxP x Ckmm cre mice (pp,cre, n = 12, 10-week old). (C) Relative mtDNA copy number in heart of Sod2 loxP x Ckmm cre mice as assessed with qPCR. MtDNA levels were analyzed with a CytB probe and nuclear DNA with a 18S probe. White circles indicate samples from controls (pp, n = 12, 10–12 week old) and gray circles indicate samples from Sod2 loxP x Ckmm cre mice (pp, cre, n = 11, 10–12 week old). Horizontal lines represent means, error bars represent SD, *P< 0.05, Student's t-test.

