Figure 1.
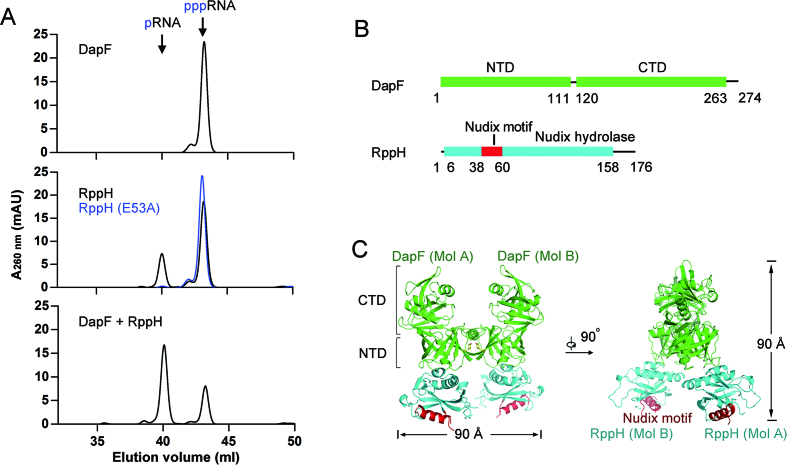
Structure of the DapF–RppH complex. (A) DapF stimulation of RppH activity is detected by ion exchange chromatography. DapF alone has no detectable activity upon triphosphorylated RNA hydrolysis (upper panel). RppH is able to hydrolyze triphosphorylated RNA into monophosphorylated RNA and its catalytic mutant RppH (E53A) is not (middle panel). DapF stimulates the activity of RppH (lower panel). (B) Ribbon diagram representation of DapF and RppH. DapF is colored green and consists of an N-terminal domain (NTD) and a C-terminal domain (CTD). RppH is colored cyan, and the Nudix motif is colored red. The numbers under the ribbons depict the boundaries of motifs or domains. (C) Overall structure of the DapF–RppH complex in two perpendicular views. The H-shaped heterotetramer consists of two DapF and two RppH molecules, approximately 90 Å in width and height. The NTD and CTD of DapF are indicated by square brackets. The tyrosine that sustains the interface of two DapF molecules (MolA and MolB) is represented as yellow sticks. The Nudix motif in the two RppH molecules (MolA and MolB) is indicated in red. All color representations are the same as in diagram (B).

