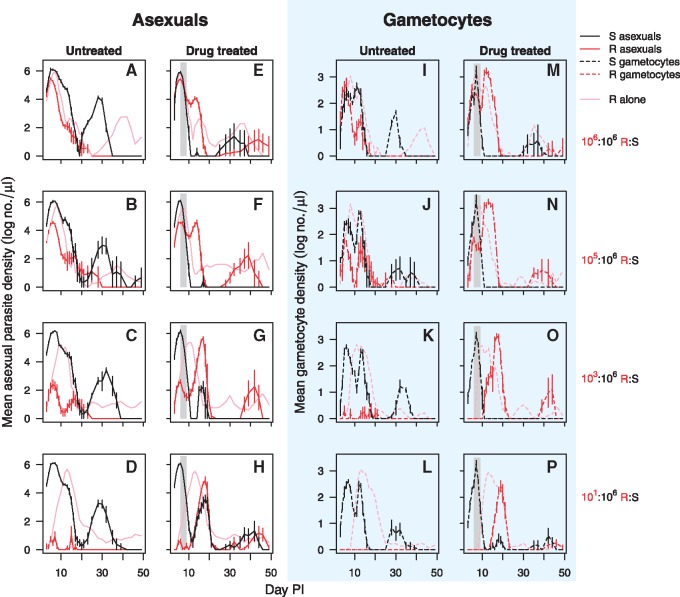
Figure 1.
Within-host dynamics of mixed clone infections. Asexual parasite densities (solid lines—left two columns) and gametocyte densities (dashed lines—right two columns in blue shaded area) of drug sensitive clone S (black lines) and drug resistant clone R (red lines) in mixed infections that were untreated (first and thirds columns) or drug-treated (second and fourth columns). Drug treatment was given on Days 6–9 post-infection as indicated by the shaded area. Infections were inoculated with a clone R:S relative abundance of 106:106 (top row), 105:106 (second row), 103:106 (third row) and 101:106 (bottom row). In light pink, the asexual parasite and gametocyte mean dynamics of clone R when in infections without sensitive parasites (full data in Fig. S1). Data are geometric means (±SEM) of up to five mice for R:S abundance of 106:106, 105:106 and 103:106, or up to 10 mice for R:S ratio 101:106 (Table 1)

