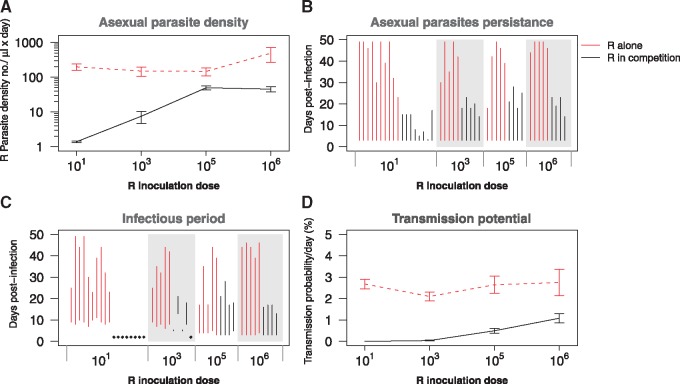
Figure 2.
Competitive suppression—comparative performance of clone R alone (red lines) and in competition (black lines) in the absence of drug treatment. (A) Geometric mean asexual parasite density of clone R at different initial parasite dosages. (B) Duration of infection of resistant parasites (time to last detection by qPCR) for the different R inoculum sizes. Each line represents the duration in a single mouse. (C) Duration of infectious period (from first to last detection of gametocytes by qPCR) for the different R inoculum sizes. Diamonds represent infections that did not produce any gametocytes; again, data for each mouse are shown. (D) Mean transmission probability per day at different initial parasite dosages based on a gametocyte density-infectivity function [65]. Data in (A) and (D) are means (±SEM) from the entire infection period (Days 3–49 PI) of up to five mice (R inoculum sizes 106, 105, 103) or up to 10 mice (inoculum size 101; Table 1)

