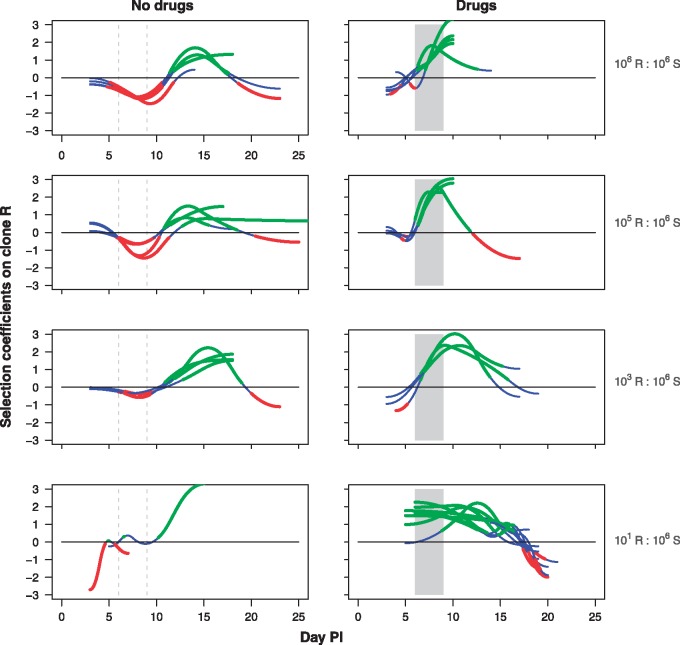
Figure 4.
Selection coefficients over time. Selection dynamics on asexual resistant parasites for each mouse in mixed infections that were inoculated with a clone R:S relative abundance of 106:106 (top row), 105:106 (second row), 103:106 (third row) and 101:106 (bottom row). Infections were either untreated (left panels) or drug treated (right panels). Drug treatment was given on Days 6–9 post-infection as indicated by the shaded area. Mean selection dynamics are shown with blue segments denoting times when selection is not statistically different from zero, red segments times when selection is statistically less than zero, and green segments times when selection is greater than zero. Selection could be calculated up to the last day that both clones were detectable, which varied between mice. In 8 out of the 10 mice in the untreated 101 R:106 S group, too few data points with both clones above detection level were available to calculate the selection coefficients

