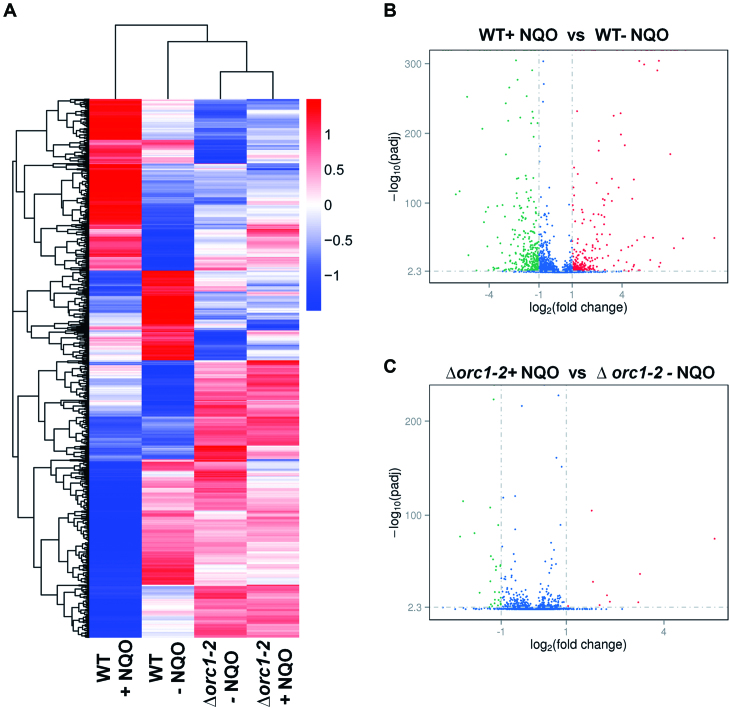
Figure 1.
Global transcriptional change mediated by Orc1-2 upon NQO treatment. (A) Heatmap of the genome expression of S. islandicus E233S1 (WT) and Δorc1-2. Both strains were grown in the presence or absence of 2 μM NQO (indicated as + NQO and - NQO, respectively) for 6 h. Cell mass was collected from which total RNAs were prepared and used for RNA-Seq analysis. Genes are clustered with their log10(FPKM+1) values and their expression levels are illustrated with different colors with red colors representing the highest levels of expression whereas blue ones indicating the lowest levels of expression. (B) Volcano plot of differentially expressed genes in the WT strain. (C) Volcano plot of differentially expressed genes in Δorc1-2. X-axis: fold change in gene expression; Y-axis: statistical significance of the fold change. Genes exhibiting >2-fold (i.e. –1 > log2 > +1) up and down regulation are highlighted in red and green, respectively, whereas those that showed a <2-fold change in differential gene expression are shown in blue.

