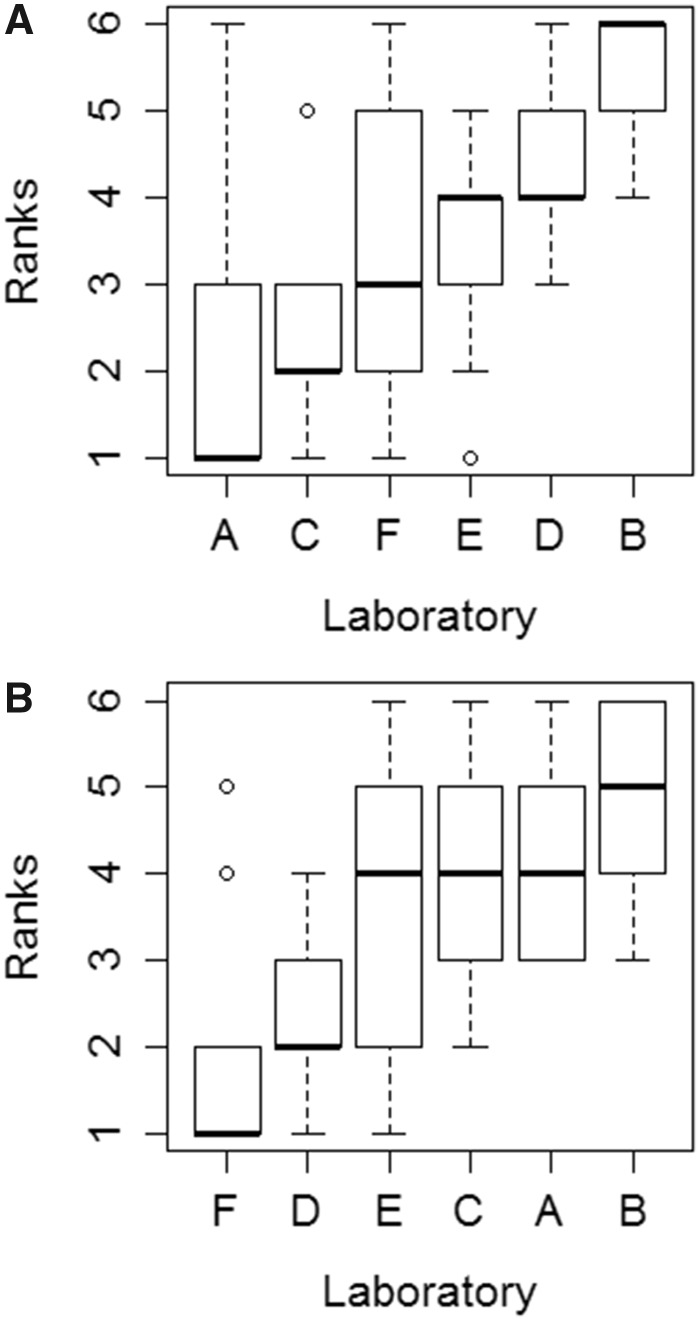
Figure 4.
Evaluation of potential laboratory bias in measured in vitro intrinsic clearance rates (CLIN VITRO, INT). Individual laboratories are identified as A–F. The median rank associated with each laboratory is shown as a horizontal thick line, and the top and bottom of each box represents the 75th and 25th percentiles, respectively. The top and bottom whiskers extend up to 1.5 times the interquartile range, whereas dots represent individual observations beyond this range. Calculated ranks are based on measured rates of activity for CS, FEN, 4NP, DM, and MC (one value for each laboratory). Additional ranks were calculated using data for pyrene (PYR; 4 independent determinations per laboratory), run as a reference chemical (n = 9 total ranks). A, Ranks determined for each laboratory based on data collected using cryopreserved rainbow trout hepatocytes (RT-HEP). B, Ranks determined for each laboratory based data collected using rainbow trout liver S9 fractions (RT-S9).

