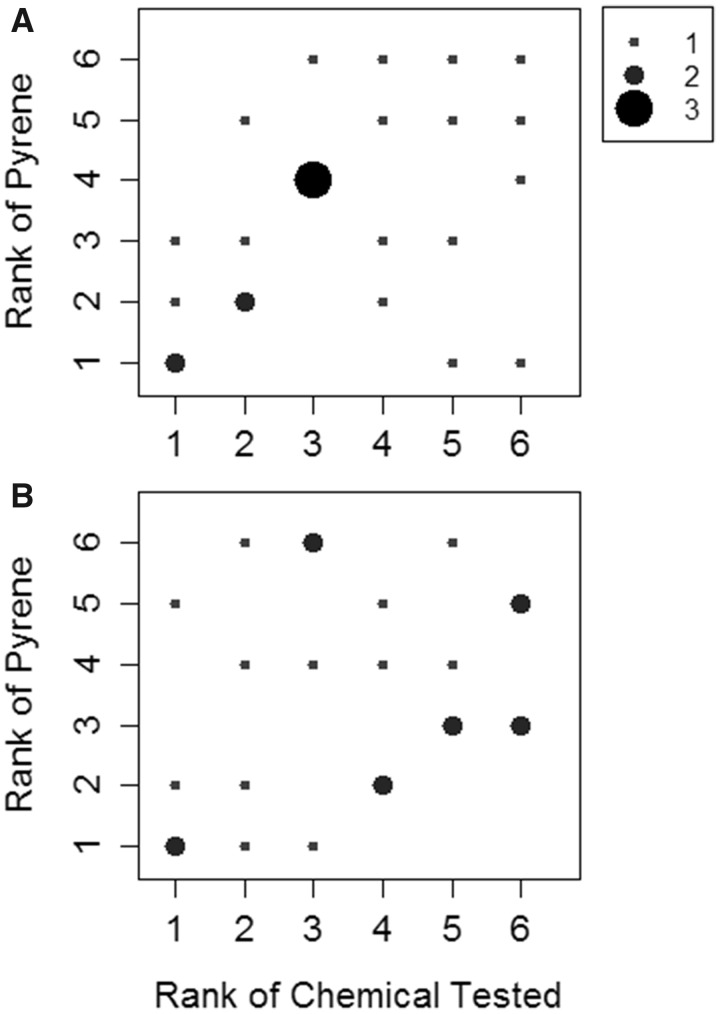
Figure 5.
Rank-rank plots showing the relationship between intrinsic clearance values for individual test chemicals and for PYR, where PYR was run alongside the same test chemical. Each observation represents a pair of ranks for one laboratory. The frequency of any given observation (1–3 out of a possible 4) is denoted by the size of the dot. A, Ranks based on data collected using cryopreserved rainbow trout hepatocytes (RT-HEP). B, Ranks based on data collected using rainbow trout liver S9 fractions (RT-S9).

