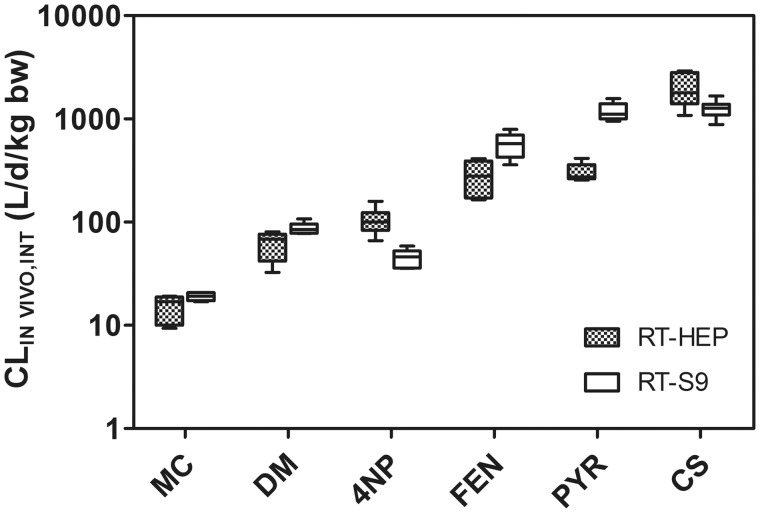
Figure 6.
Estimated in vivo intrinsic clearance rates (CLIN VIVO, INT) for MC, DM, 4NP, FEN, PYR, and CS. CLIN VIVO, INT values were calculated from measured rates of in vitro intrinsic clearance obtained using cryopreserved rainbow trout hepatocytes (RT-HEP) or trout liver S9 fractions (RT-S9). Means calculated for all laboratories are shown as horizontal lines. Values shown for MC, DM, 4NP, FEN, and CS represent data generated using chemical-specific lots of biological material, whereas those given for PYR represent studies performed using all 5 lots of tested material. Boxes denote the 25th and 75th percentiles, whereas top and bottom whiskers extend up to 1.5 times the interquartile range.

