Figure 2.
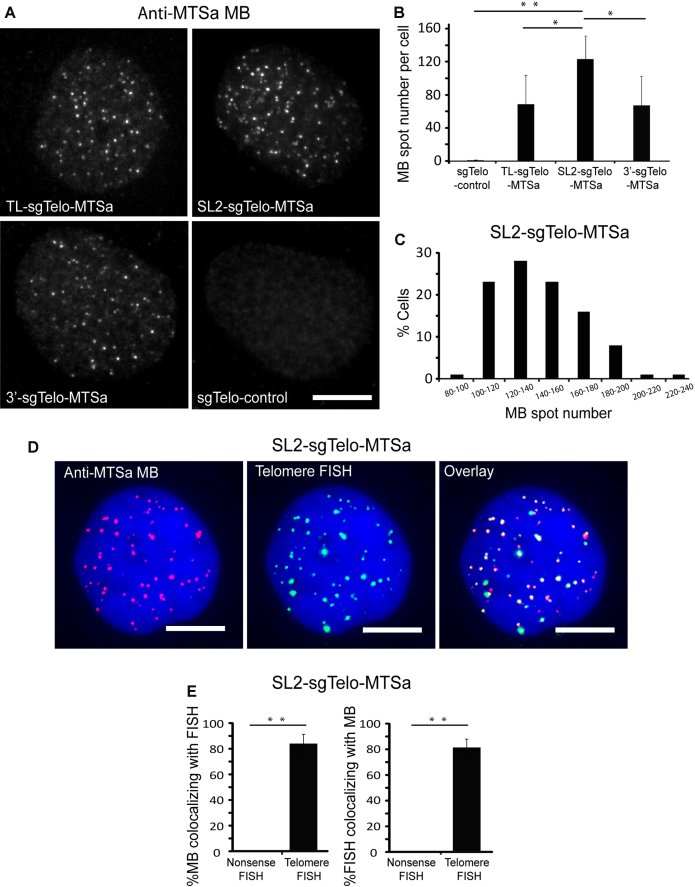
Specific labeling of telomeres using CRISPR/MB. Following transfection of HEK293 cells with dCas9 and either TL-, SL2-, 3′-sgTelo-MTSa or sgTelo-control, cells were microporated with 1 μM anti-MTSa MBs (ATTO647N-labeled) and imaged at 24 h post-microporation. (A) Representative maximum intensity projection images of MB signals in fixed cells. Scale bar = 10 μm. (B) Quantification of MB fluorescence spot number per cell. Data represent mean ± S.D. of at least 60 cells. (C) The distribution of spot number per cell in cells transfected with SL2-sgTelo-MTSa. n = 100 cells. (D) Detection of telomere loci by MBs and DNA FISH. Cells transfected with SL2-sgTelo-MTSa were fixed and permeabilized and then processed by FISH using telomere-targeting or nonsense FISH probes (TAMRA-labeled). Representative maximum intensity projection images of anti-MTSa MBs and telomere-targeting FISH probes are shown. DAPI stains the nucleus. Scale bar = 10 μm. (E) The percentage of MB signals that were colocalized with FISH signals (%MB colocalizing with FISH) and the percentage of FISH signals that were colocalized with MB signals (%FISH colocalizing with MB) on a cell-by-cell basis were calculated using a custom MATLAB program (see Materials and Methods: Colocalization analysis). Data represent mean ± S.D. of at least 13 cells. For (B) and (E), asterisks indicate P-values (* P < 0.05, ** P < 0.01).

