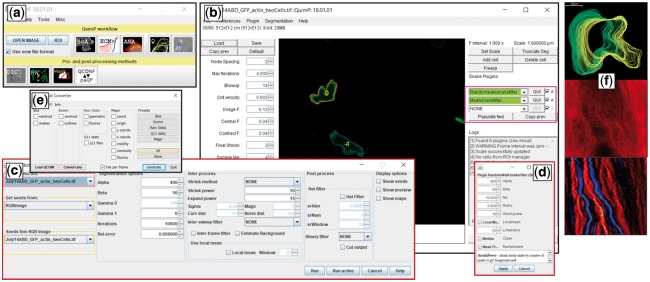
Fig. 1.
QuimP GUI for analyzing cell motility. (a) QuimP toolbar, with tools arranged in the order of a typical workflow. Upper row: Open image time series, and main data analysis plugins (BOA: cell segmentation, ECMM: contour tracking, ANA: sampling of cortical fluorescence, QA: detailed quantitative analysis and visualization in the form of spatial-temporal maps, PA: protrusion analysis (experimental, working Matlab routines are provided)). Bottom row: Pre- and post-processing plugins (DIC: DIC image reconstruction, RW: customized random walk segmentation, Mask: Cell outline to mask converter). (b) BOA segmentation window with novel feature of external contour filters. (c) Interface for the new random walk segmentation module. (d) New BOA plugin that integrates random walk and active contour segmentation. (e) Conversion tool to export csv files. (f) Exemplary results from the QA module: cell outlines, fluorescence map, convexity map

