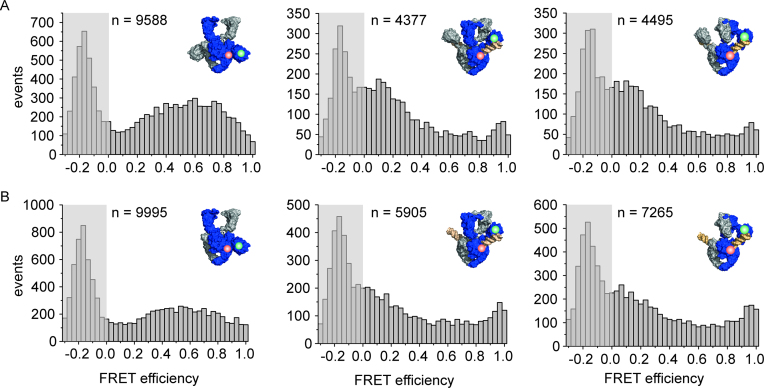
Figure 6.
DNA-induced CTD movement monitored by single-molecule FRET. Single-molecule FRET histograms for gyrase labeled with donor (green) and acceptor (red) in the NTD and CTD of one GyrA subunit. The area at EFRET < 0 contains the peak representing molecules that carry only the donor fluorophore, and is shaded in gray. n denotes the number of events accumulated in each histogram. (A) Gyrase with both CTDs (B·AT140C/K594C·A·B), labeled with donor and acceptor fluorophores in the NTD and CTD of one GyrA subunit, shows a broad FRET histogram (left), in agreement with flexible attachment of the CTDs to the GyrA NTD. Addition of DNA (center) leads to a decrease in FRET efficiencies, indicative of an upward movement of the CTDs. Addition of ADPNP (right) does not further affect the FRET efficiency histogram and thus the position of the CTDs. (B) Gyrase with one CTD (B·AT140C/K594C·AΔCTD·B) shows a similar FRET histogram as gyrase with two CTDs. Addition of DNA (center) also leads to a decrease in FRET efficiency. Addition of ADPNP does not induce any further changes in FRET efficiency and CTD position. Concentrations were 150 pM GyrA (donor concentration), 8 μM GyrB, 20 nM relaxed pUC18, and 2 mM ADPNP.

