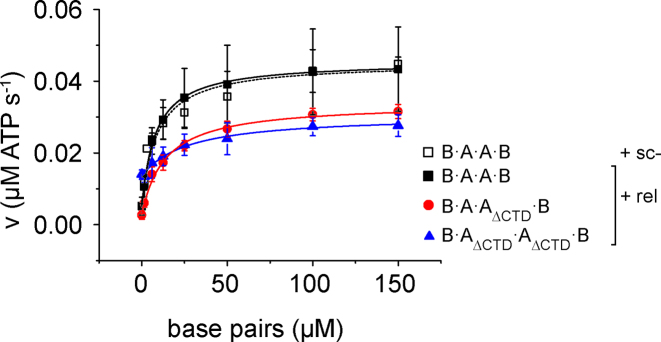
Figure 8.
Effect of the CTDs on DNA-stimulated ATPase activity of gyrase. Steady-state ATPase activity of gyrase containing two, one, or no CTD(s) at 37°C with 0.1 μM GyrB, 0.5 μM GyrA and 1.5 mM ATP as a function of the concentration of negatively supercoiled DNA (sc-; B·A·A·B; black, open squares) or relaxed DNA (rel; B·A·A·B: black squares, B·A·AΔCTD·B: red circles; B·AΔCTD·AΔCTD·B: blue triangles). Error bars denote standard deviations from three to five independent experiments. The kcat and Kapp,DNA values obtained from analyses with the Michaelis-Menten equation are summarized in Table 1.

