
Fig. 8.
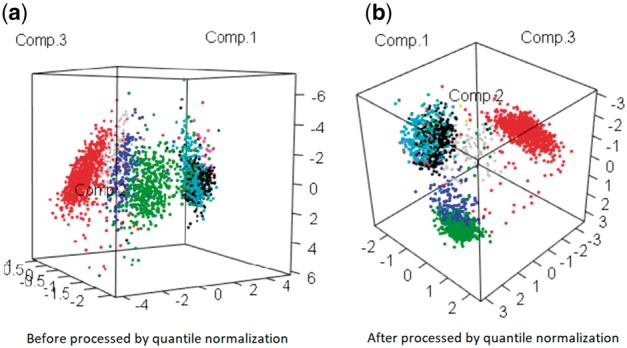
PCA plots based on (a) raw data (Muraro et al., 2016) and (b) dissimilarity matrix obtained by the interpolating quantile normalization. Colors refer to the cell types
Official websites use .gov
A
.gov website belongs to an official
government organization in the United States.
Secure .gov websites use HTTPS
A lock (
) or https:// means you've safely
connected to the .gov website. Share sensitive
information only on official, secure websites.
PCA plots based on (a) raw data (Muraro et al., 2016) and (b) dissimilarity matrix obtained by the interpolating quantile normalization. Colors refer to the cell types