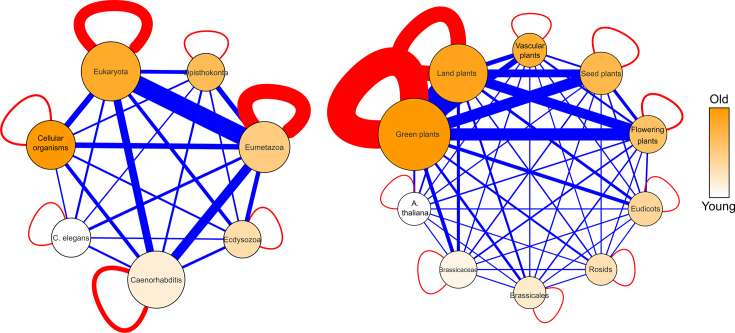
Figure 7.
Total number of directed and undirected interactions between age groups of Arabidopsis thaliana (left) and Caenorhabditis elegans (right). The nodes are scaled according to the number of genes in the age group and colored according to age (darker = older). Red edges are within the age groups, blue edges are between the age groups. The thickness of the edge is scaled to the number of interactions (full list in Supplementary Table S12).

