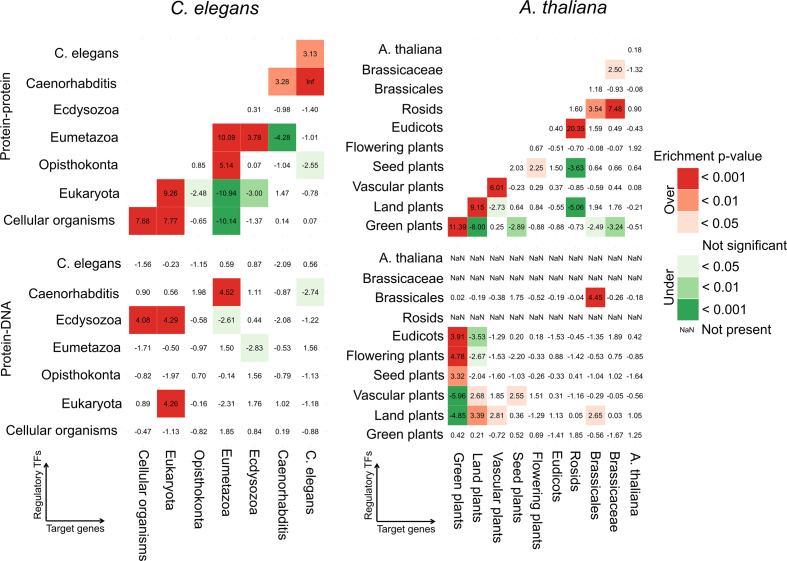
Figure 8.
Interaction age preference for physical protein–protein and protein–DNA interactions in Caenorhabditis elegans (left) and Arabidopsis thaliana (right). Enrichment (Z-score and associated P-value corrected for multiple hypothesis testing) of the comparison of the observed number of interactions within and between age groups in the real networks versus the expected number in 1000 randomized networks with the same age distribution. In the protein–DNA networks, the regulatory TFs are on the vertical and the target genes are on the horizontal axis.

