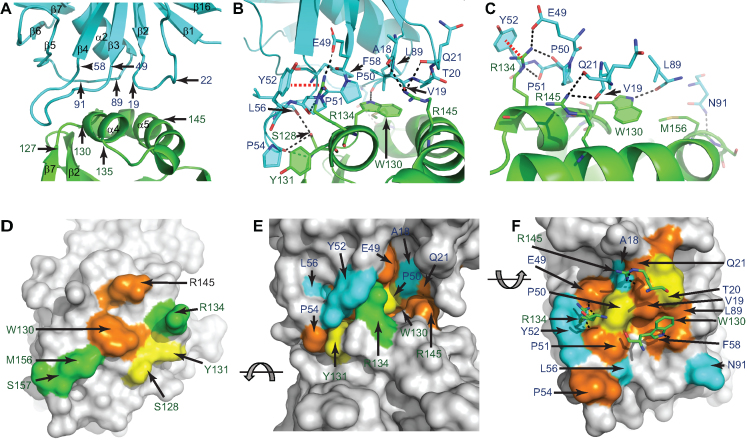
Figure 4.
The RppH–DapF interface. (A) Interface between RppHt (green) and DapFm (cyan). The locations of several amino acids defining the boundaries of the interacting regions are indicated. (B) Contacts between RppH and DapF. Amino acids located ≤3.5 Å from atoms of the partner protein are shown in sticks. Potential hydrogen bonds and cation-π interactions are represented by dashed black and red lines, respectively. (C) View highlighting intermolecular interactions that involve W130, R134 and R145 of RppH. (D–F) Conservation of the amino acids shown in panel (B). (D) and (F) show the interacting surfaces of RppH and DapF, respectively. (E) depicts a side view of the RppH–DapF complex. Identical and similar residues conserved in >70% (orange), 50–69% (yellow), or <50% (green for RppH and cyan for DapF) of a representative set of protein sequences from γ- and β-proteobacteria (43) are indicated. Residues colored grey are >3.5 Å away from the partner protein. Panel (F) highlights the position of W130, R134 and R145 (in sticks) of RppH near conserved interface residues of DapF.

