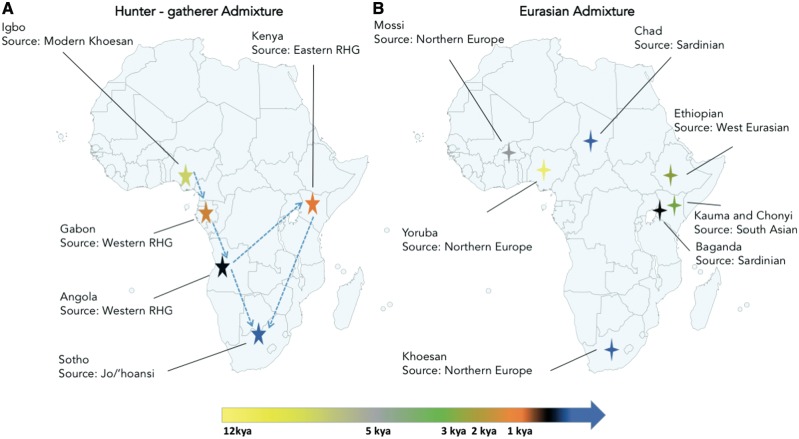
Figure 2.
Hunter-gatherer (HG) and Eurasian admixture in African populations showing possible sources and timing of events. (A) shows HG admixture events while (B) shows Eurasian admixture events. Blue dotted arrows indicate the route of the Bantu expansion (reflecting the late split), while the colours of the stars and crosses correspond to the suggested timing of admixture events (kya) as shown on the scale at the bottom of the diagram. Populations are labelled as identified in the literature.

