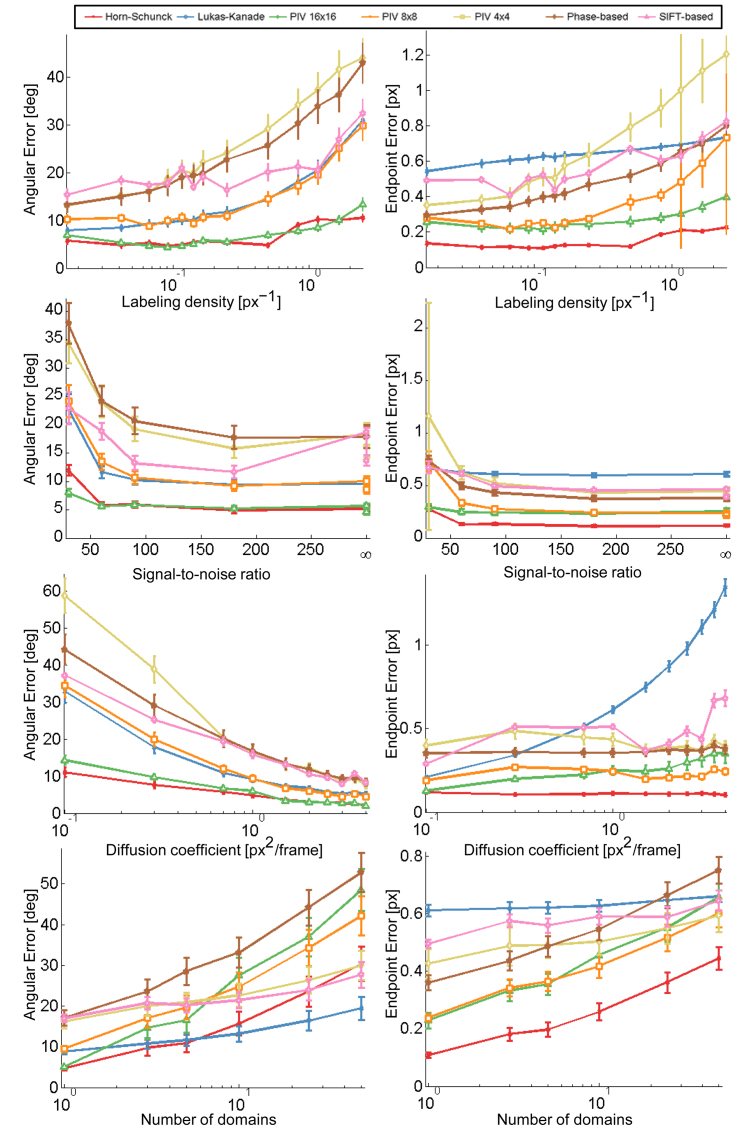
Figure 1.
Performance of different OF methods. Angular and EE for each method is shown under variation of static (labeling density and SNR) and dynamic parameters (diffusion coefficient and number of domains). AE is shown in the left column, EE in the right; parameters are shown in rows and vary from low to high values. The response of each method in terms of AE and EE is plotted (see Supplementary Table 2 and Note 1). Error bars are symmetric and correspond to the standard deviation from 10 simulations. Lower AE and EE mean more accurate estimates.

