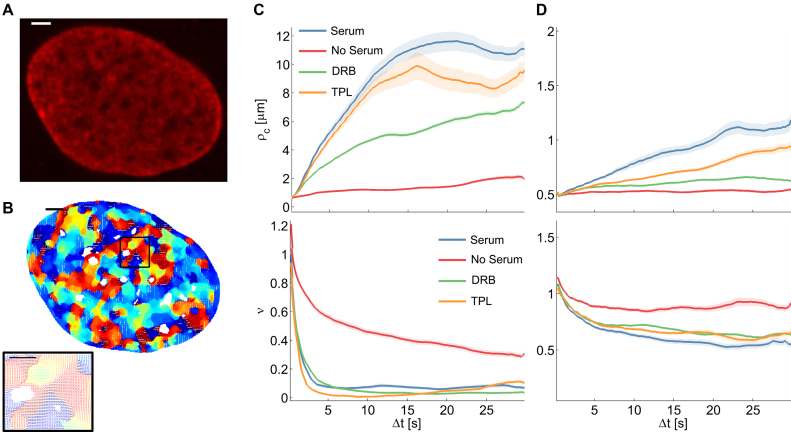
Figure 4.
Correlation length and smoothness in direction and magnitude of DNA in U2OS cells using the WM model (A) A fluorescence microscopy image of a nucleus where DNA was labeled using Sir–Hoechst; scale bar is 3 μm. (B) Flow field for  and enlarged region (right) of the black rectangle; the field is color-coded according to the direction of the displacement. Scale bar is 3 μm (left) and 1 μm (right). (C) Correlation length (top) and smoothness parameter (bottom) calculated from regression of empirical correlation functions over time for directional correlation of flow fields. Different colors correspond to different conditions. Shaded error bars correspond to the standard deviation over 18 nuclei per condition. (D) As (C) for the vectors’ magnitude.

